Overview
The Survey Responses & Analytics feature provides a detailed view of survey performance, helping you track user engagement and response trends. With this feature, you can analyze completion rates, response distribution, and user interaction. Filtering options allow you to drill down into specific segments, pages, or survey creators for more granular insights.Details Tab
Clicking on a survey in the dashboard opens the Details tab, where you can preview and edit the survey. This section ensures you have full visibility before making modifications.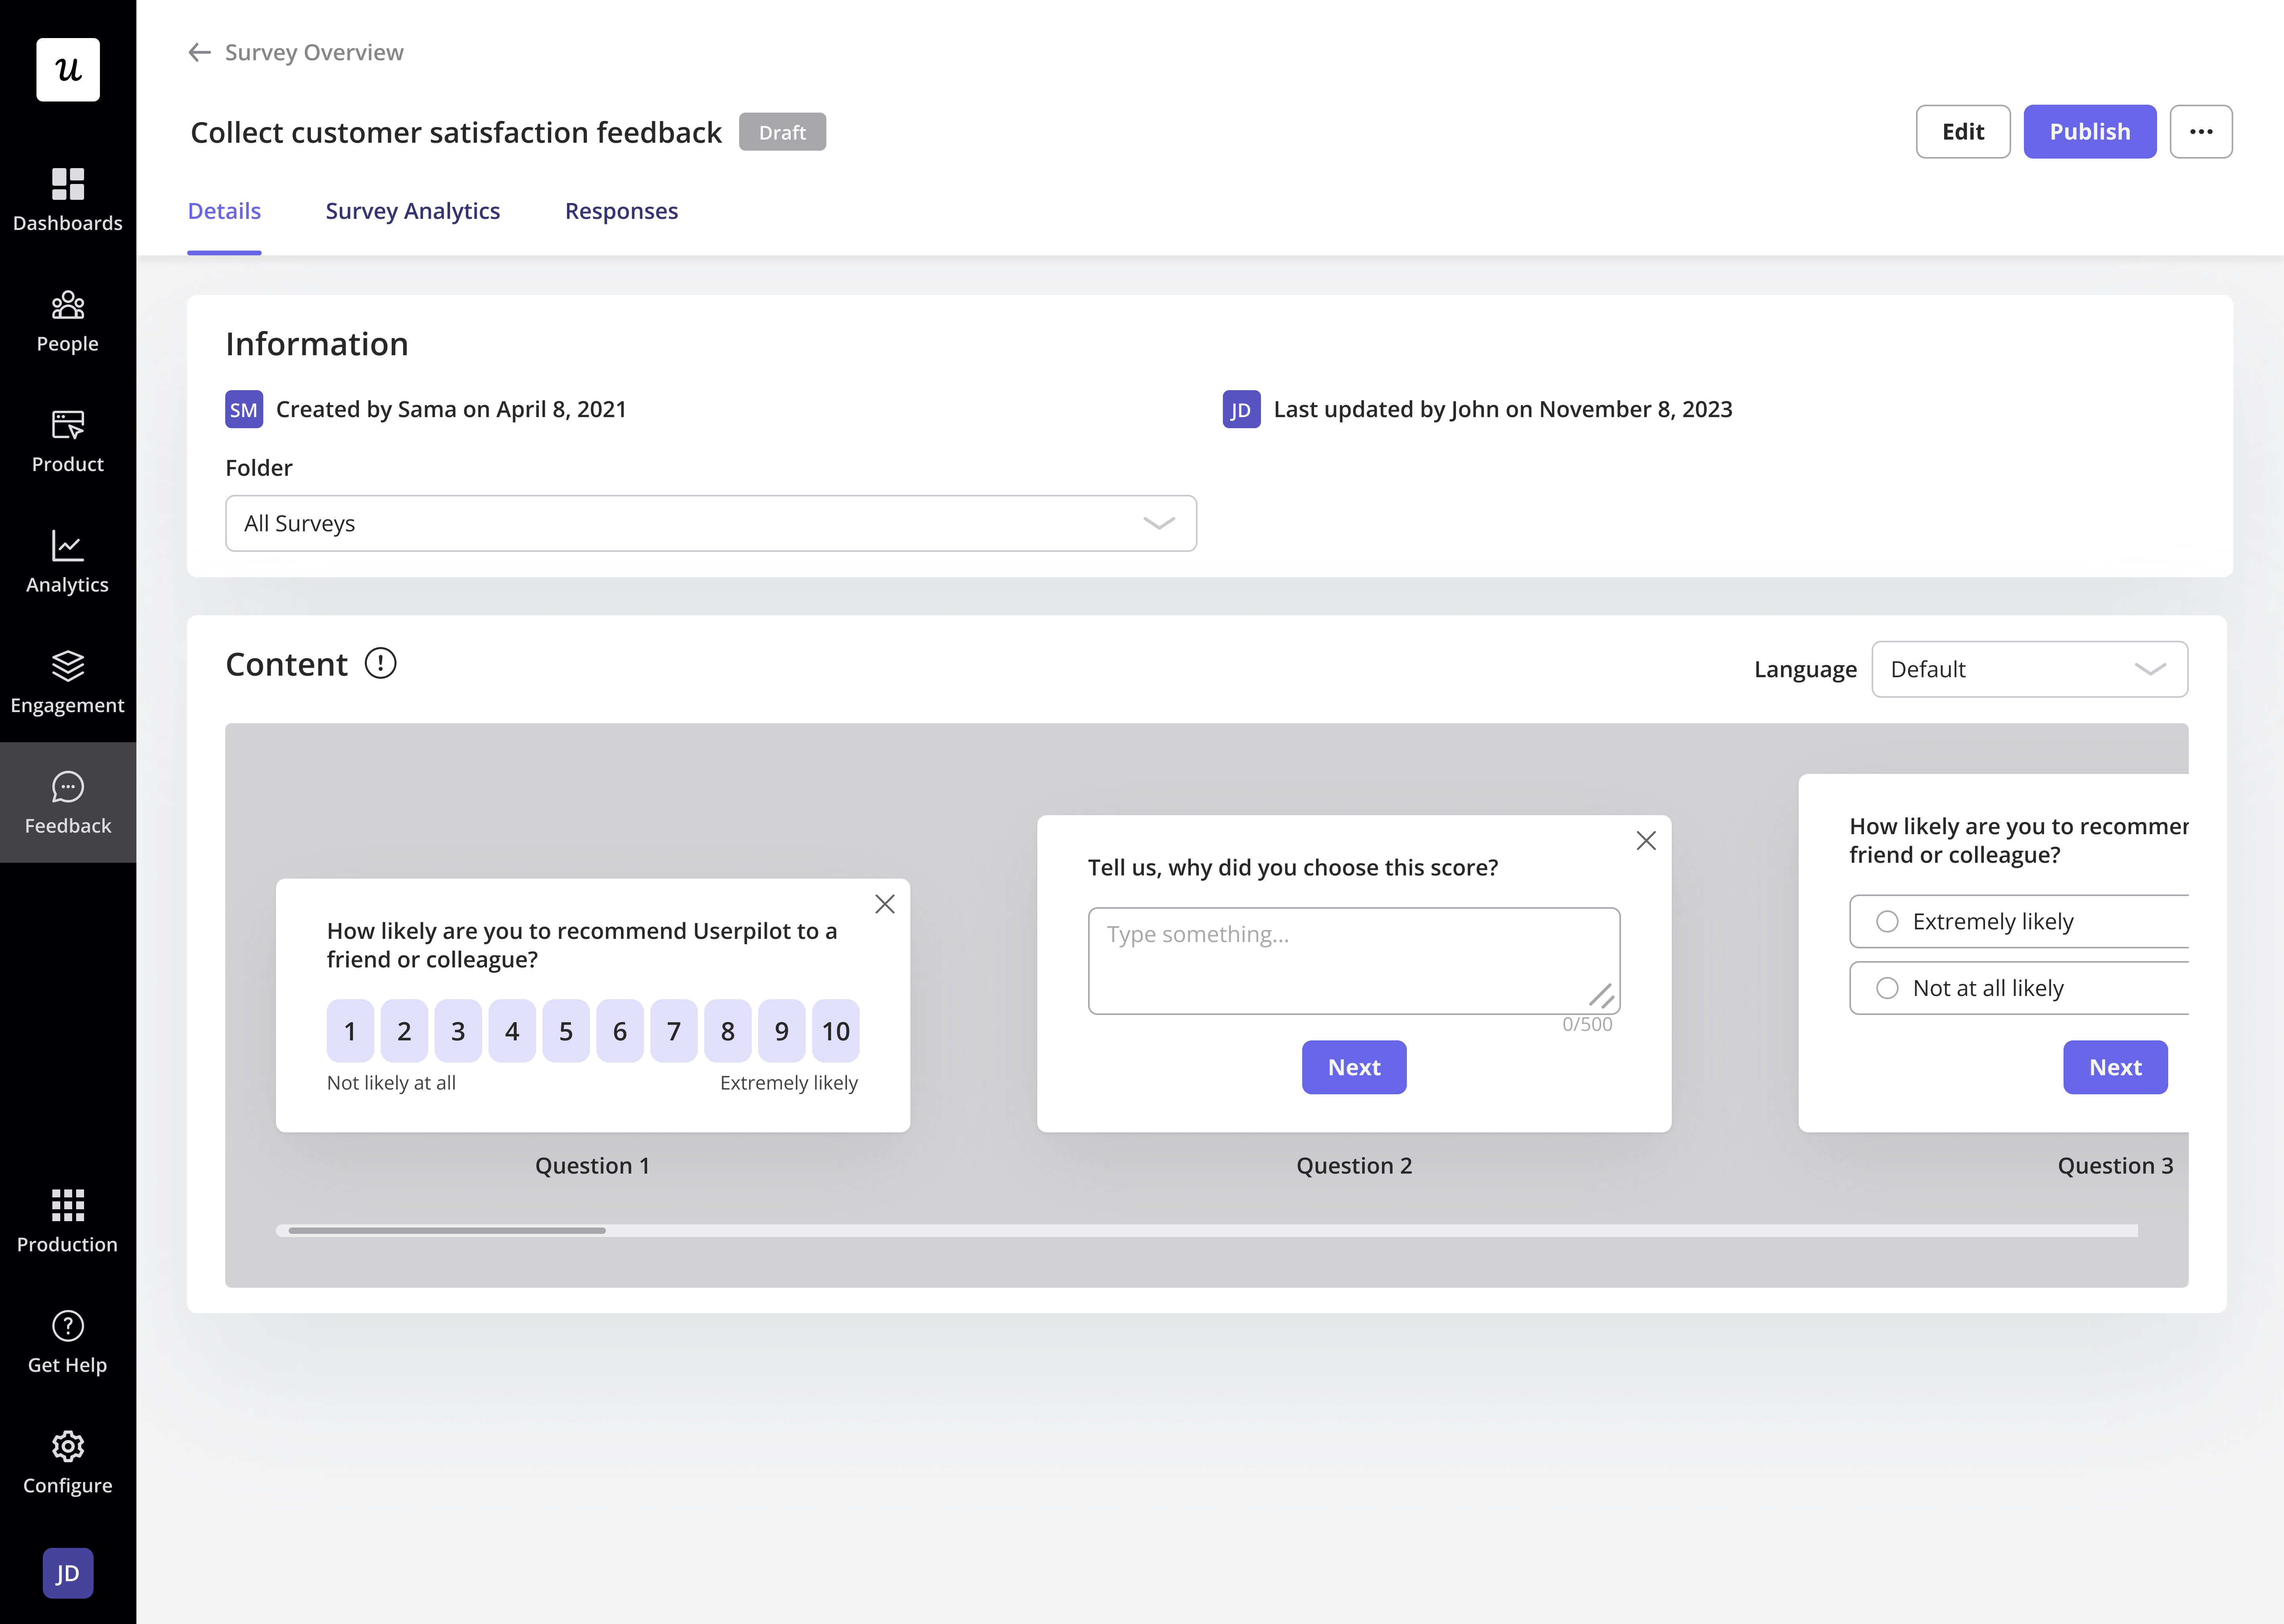
Survey Analytics
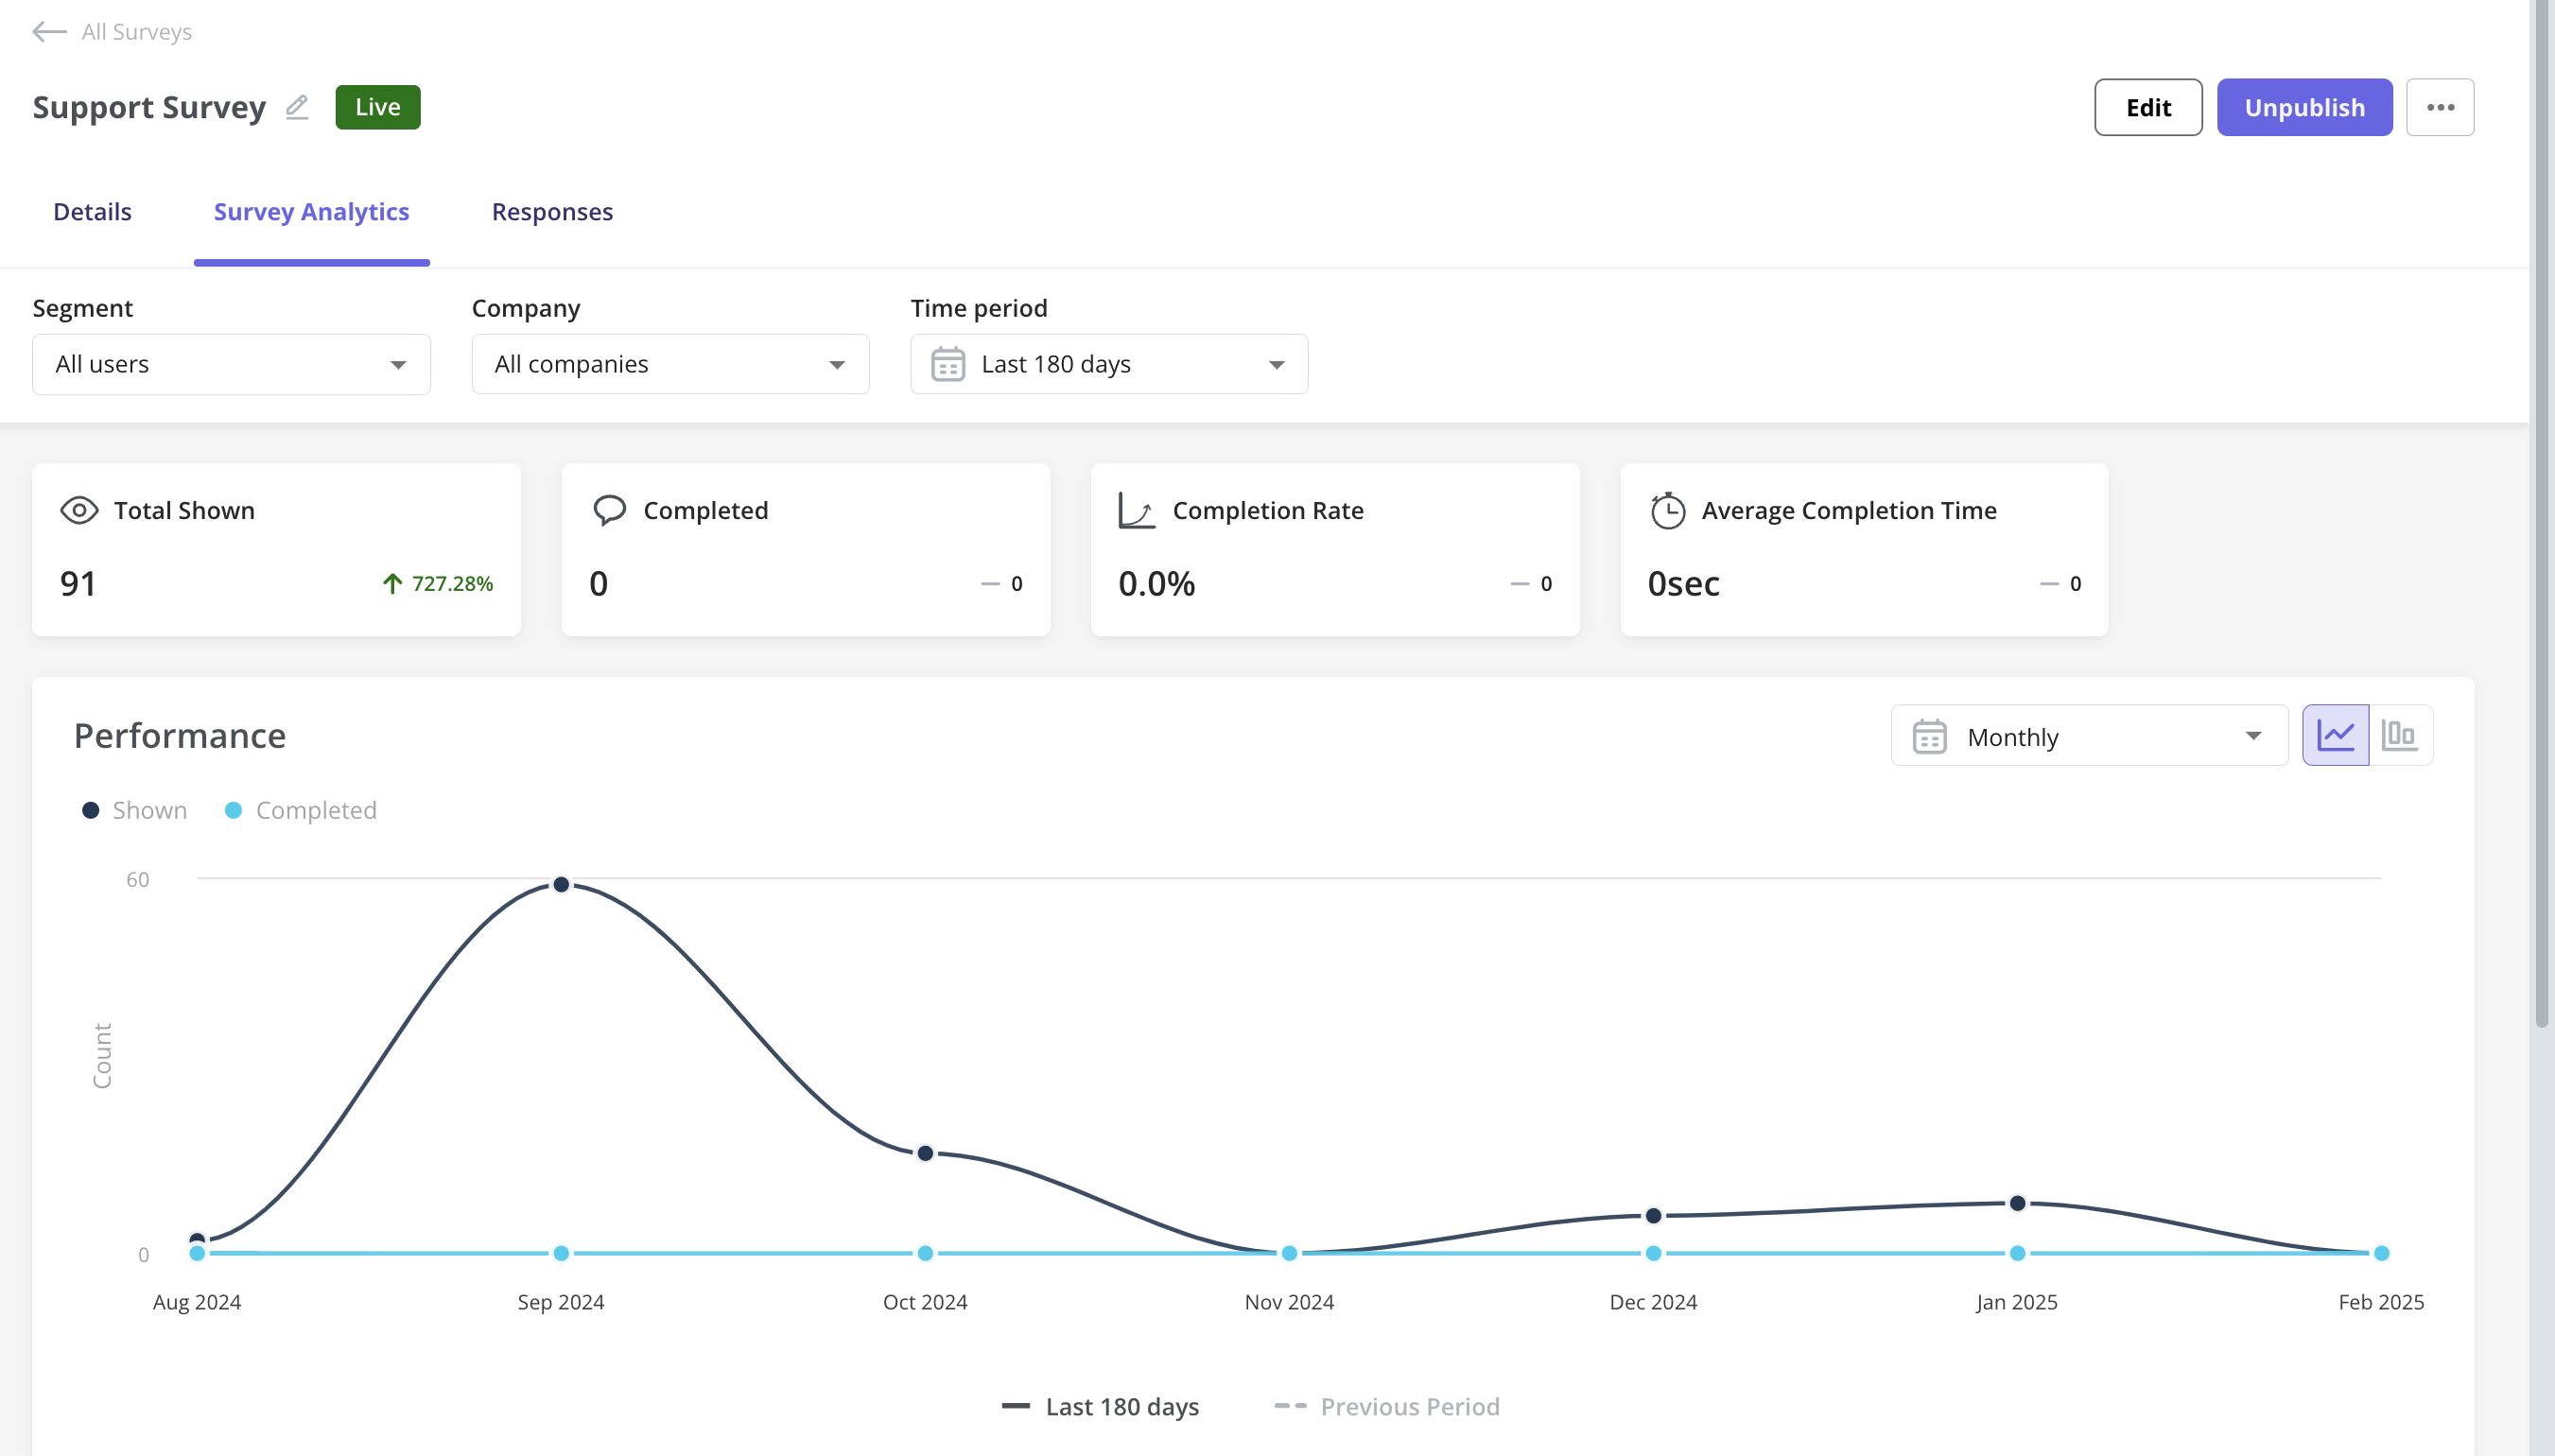
The Survey Analytics tab provides key performance insights with filtering options by segment, company, and time period. The main metrics include:- Total Shown: Number of users who have seen the survey.
- Completed: Users who answered all questions or reached a logical survey endpoint.
- Completion Rate: Percentage of users who completed the survey. Users who completed the Survey divided by users who have seen it, multiplied by 100%.
- Average Completion Time: Time taken on average to complete the survey.
Questions Breakdown
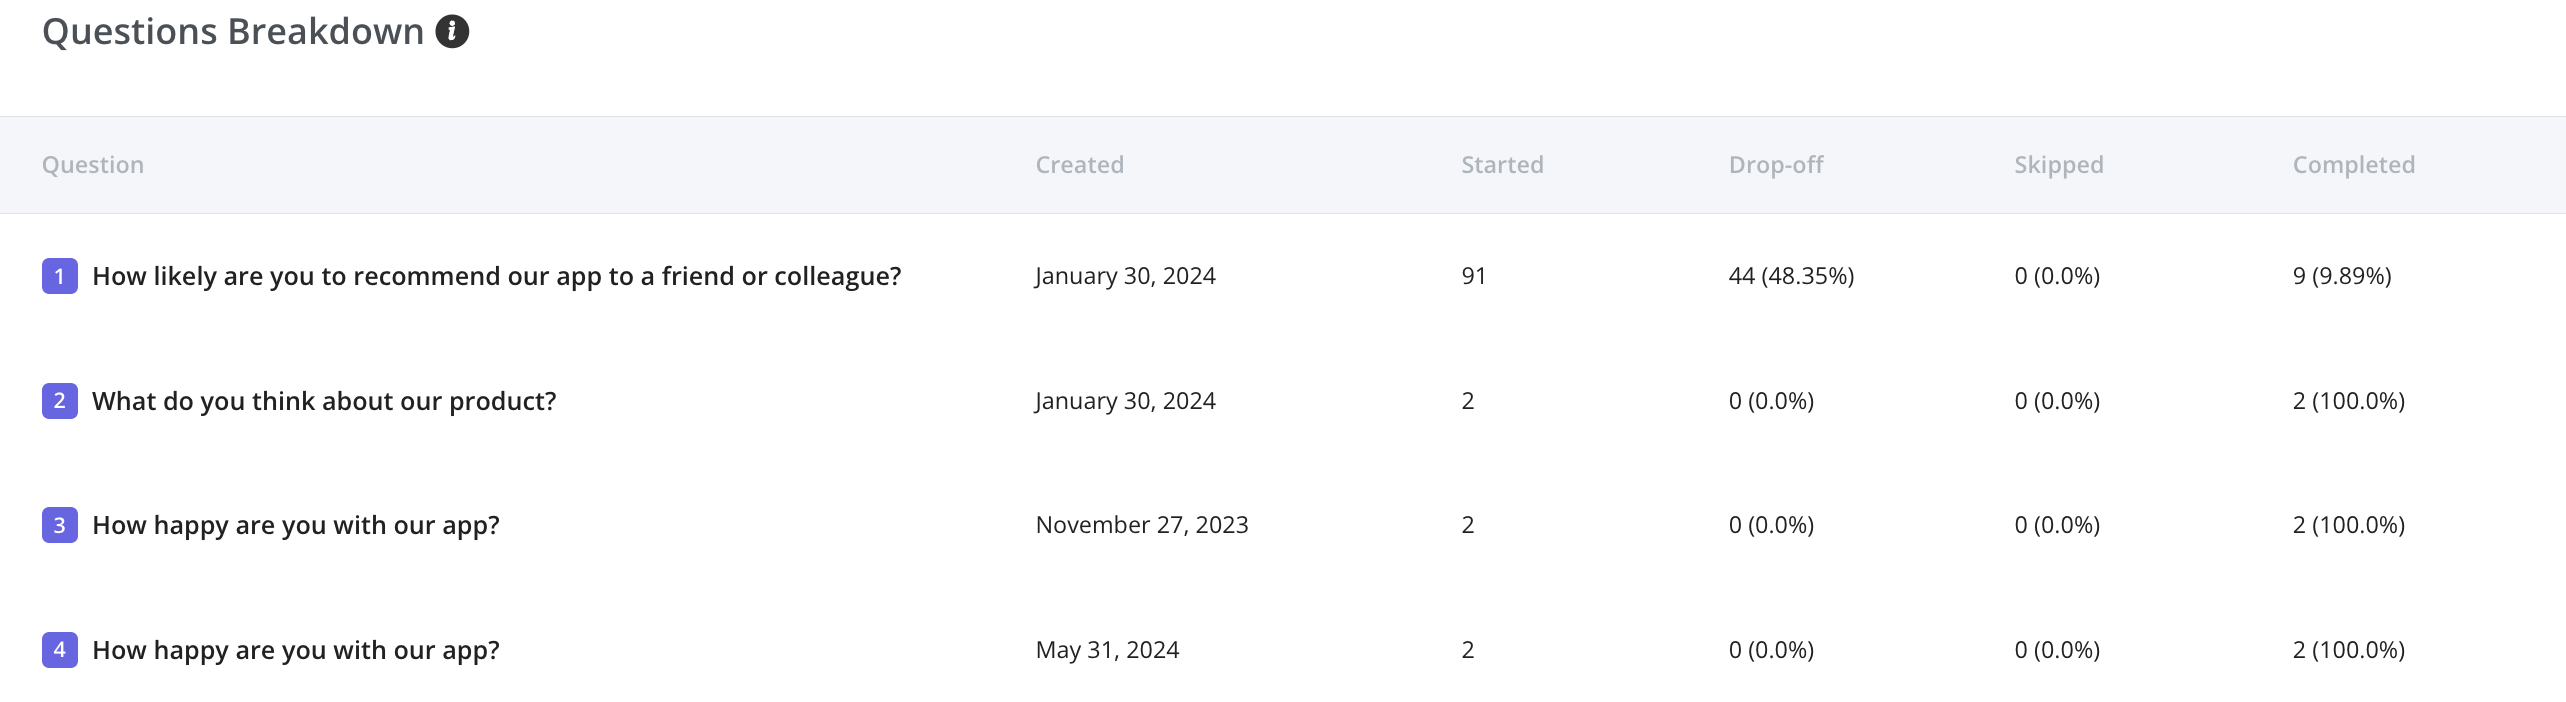
- The questions breakdown section provides insights into individual survey questions.
- Metrics include:
- Started: Number of users who viewed the question.
- Dropped Off: Users who exited before answering.
- Skipped: Users who bypassed the question.
- Completed: Users who answered the question.
Responses
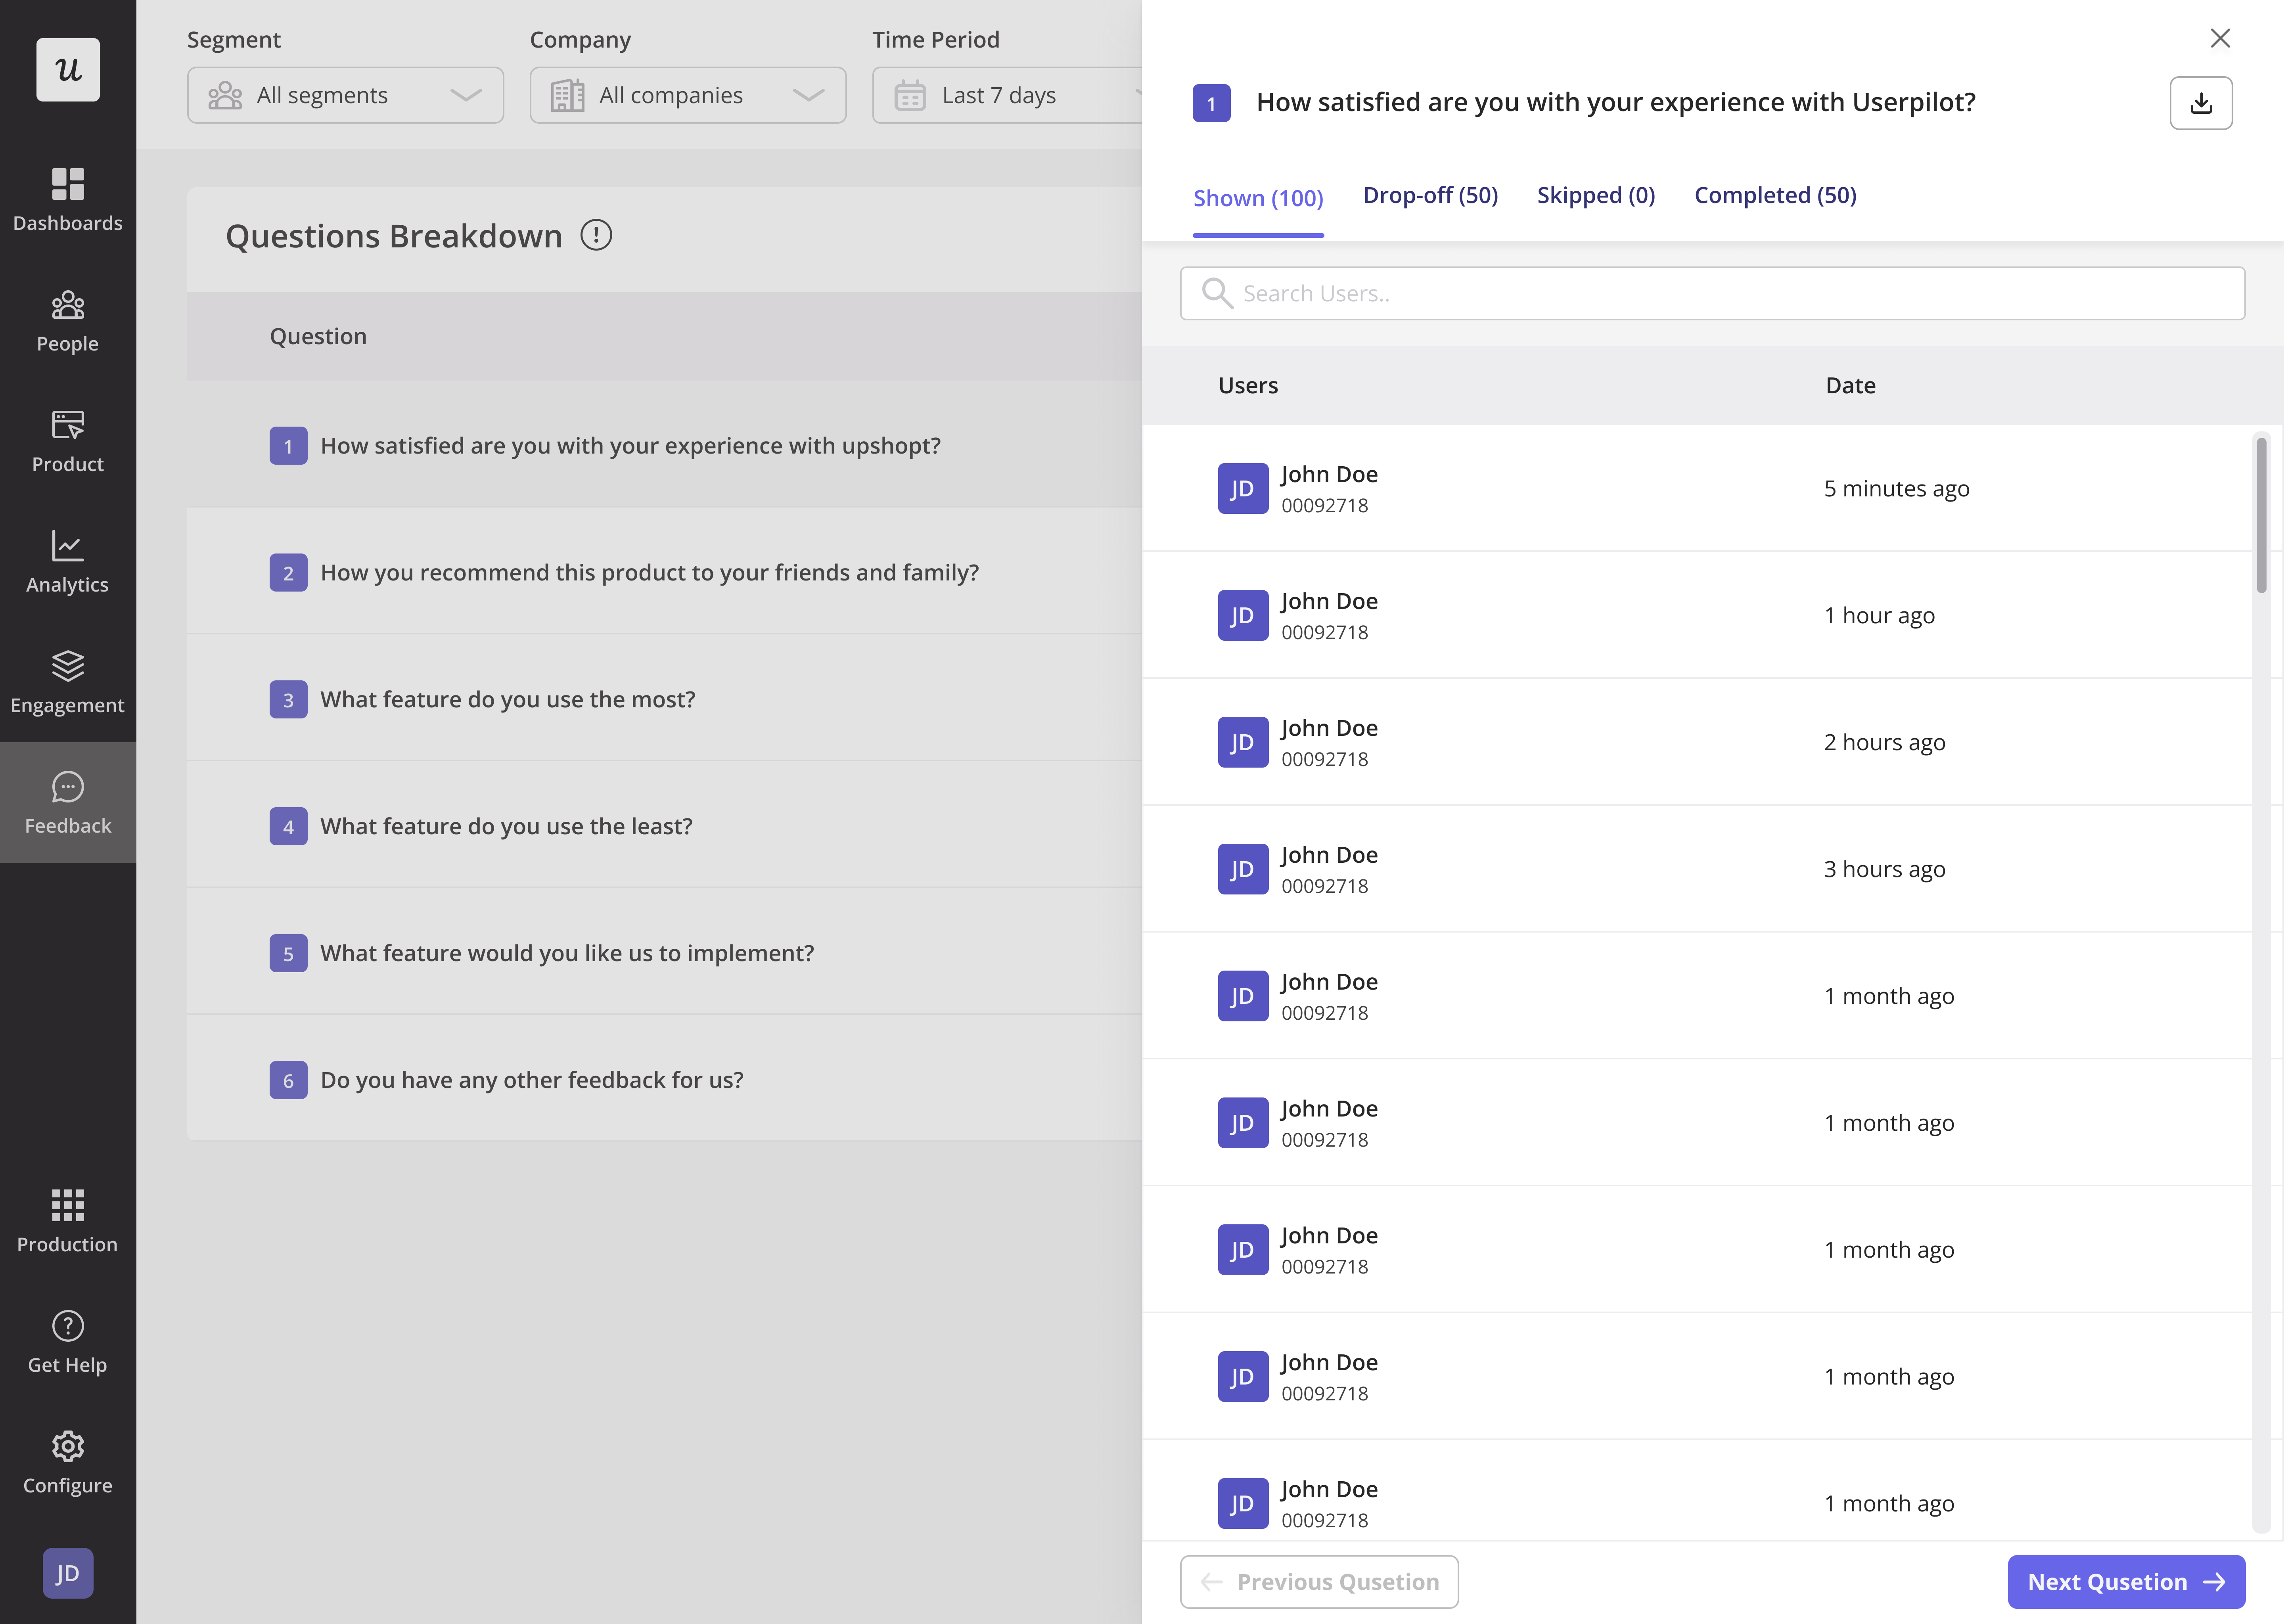
Questions are shown as pie or bar charts for Likert Scale & Multiple Choice questions. Open text responses include user details, timestamps, and are searchable. The Users tab shows responses per user. Click a user to view response history and navigate using next/previous options.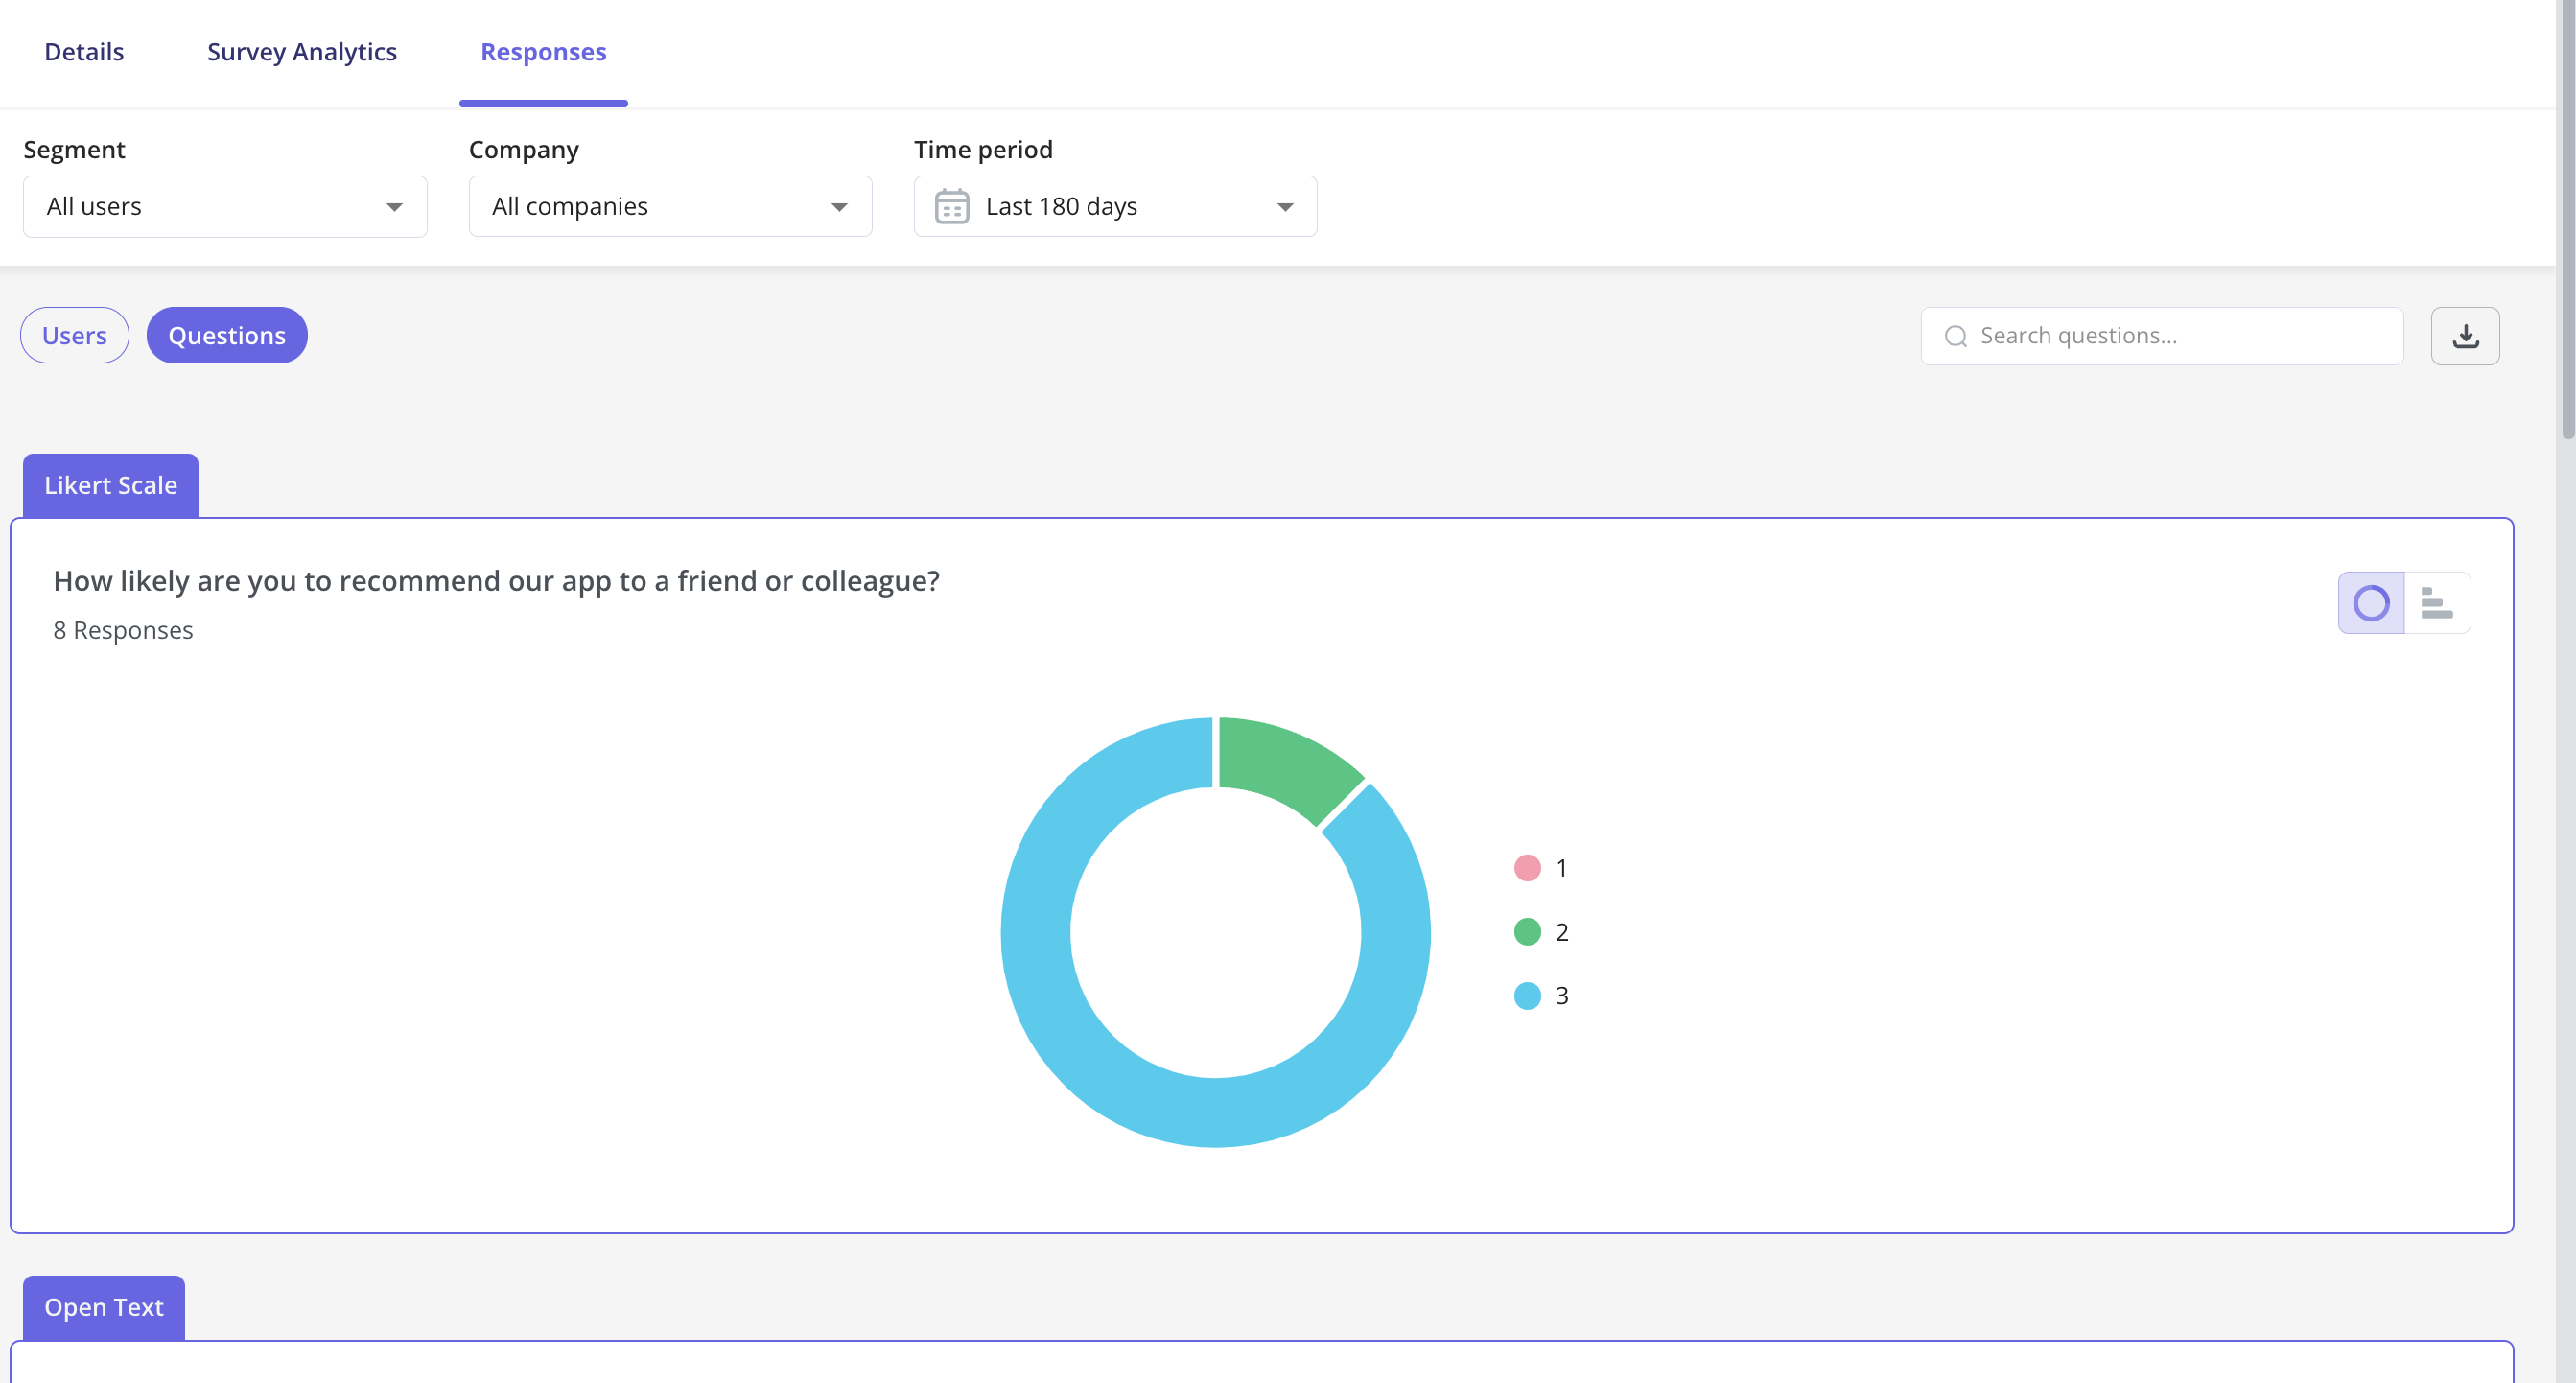
FAQs
What happens if a user takes the survey multiple times?
What happens if a user takes the survey multiple times?
User responses are recorded separately, and previous answers can be accessed in the Users tab.
Can I A/B test surveys?
Can I A/B test surveys?
Currently, A/B testing is not built-in, but you can manually compare performance by creating multiple versions and targeting different segments.
What happens if a user starts a survey but doesn't complete it?
What happens if a user starts a survey but doesn't complete it?
Partial responses are recorded, and drop-off rates can be analyzed in the Questions Breakdown section.