Retention Reports are only available for Growth and Enterprise plans.
Use cases
- Measure ongoing engagement – See how many users remain active after a set time period (e.g., two weeks after signup).
- Track feature stickiness – Monitor what percentage of users continue performing key actions (e.g., continue using key feature after seven days).
- Analyze retention trends – Understand how retention rates (e.g., key feature retention) change over time.
- Uncover behavioral patterns – Identify how frequently users return within specific time windows (e.g., interacting with key feature every day).
Getting Started with Retention Reports
To get started with creating a Retention report, navigate to the Retention page from the navigation bar or through the ‘Create Report’ button within the Saved Reports page.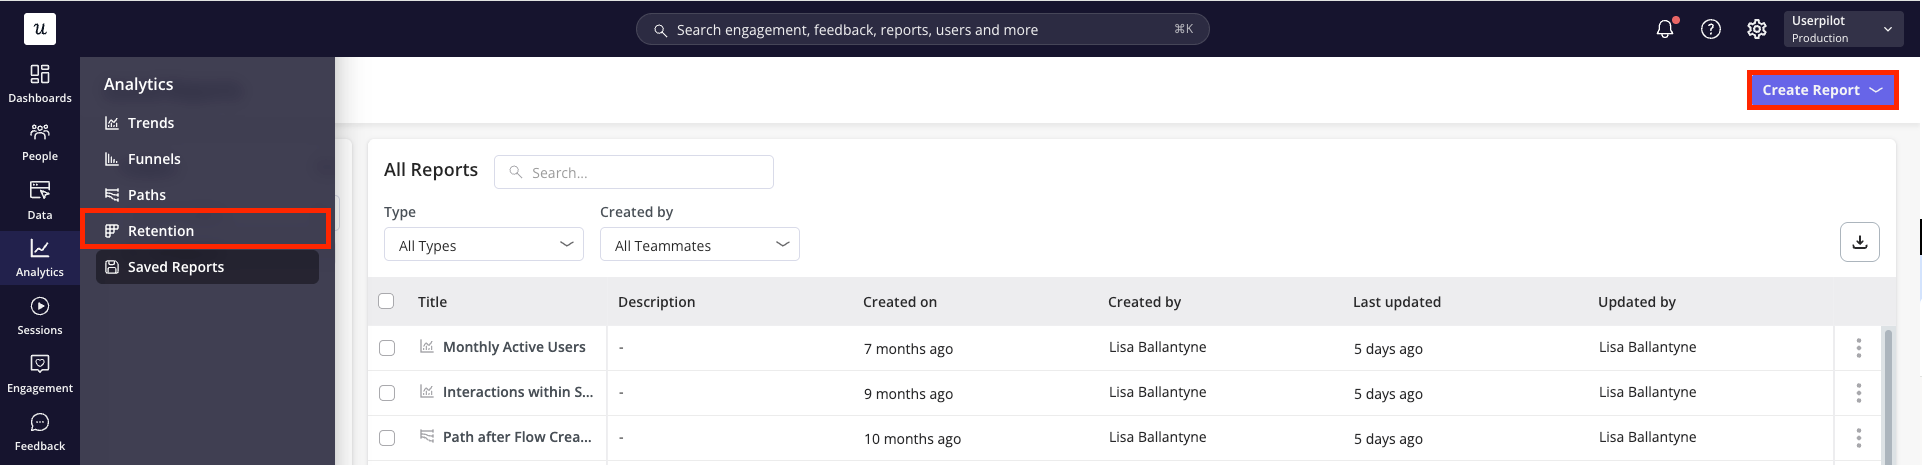
Building your Retention Report
- Firstly, choose whether you’d like to analyse the data on a user or company level.
.png?fit=max&auto=format&n=j6BdSiRiF3SCgUJf&q=85&s=abd9930778406374a30b7583bf7a98b5 "Image(31) Pn")
- Next, define the metrics to include in your report.
- The Starting Metric specifies the initial action users must perform to be included.
-
The Returning Metric defines the action you want to measure retention against.
You can choose these metrics from three categories:
- Events: Based on occurrences of labeled events, tracked events, custom events, or feature tags.
- Pages: Based on views of your tagged pages
- Content Engagement: Based on interactions with your Userpilot content.
- Once you’ve specified your key metrics, specify how you’d like these metrics to be measured:
- Unique users: count a single entry per user. This will represent the first time a user interacts with the starting event within the specified time period
- Total count: count multiple entries per user. Users can re-enter the retention report multiple times throughout the selected time period and each time will be accounted for within the data.
- Filter your data to focus only on the most relevant information. Metrics can be filtered by:
- Event Properties (for inline filters only)
- User Properties (for user-level data only)
- Company Properties
- Segments
Analyzing your Results
Click ‘Run Query’ and choose the right data presentation options for your needs.- Within the header, specify the: a. Chart period: choose a time period from the default options (e.g. past 7 days, past 30 days, etc.) or specify a custom date range b. Platform: focus on data from all platforms or choose to filter to only web or mobile data c. Data point period: specify whether each data point should represent a day, week or month d. View of data: choose between a split view or focus solely on the chart or table data
.png?fit=max&auto=format&n=j6BdSiRiF3SCgUJf&q=85&s=29f3b092b08f096ad349f5bd2cc2cb76)
- Analyze your retention report using the:
- Retention Trend – A line graph showing the average retention and drop-off rates for users or companies over days, weeks, or months following the starting event. (Example: Regardless of the date a user performs the starting action, if they return to complete the returning action the next day, they are counted as retained in the “Day 1” data point.)
-
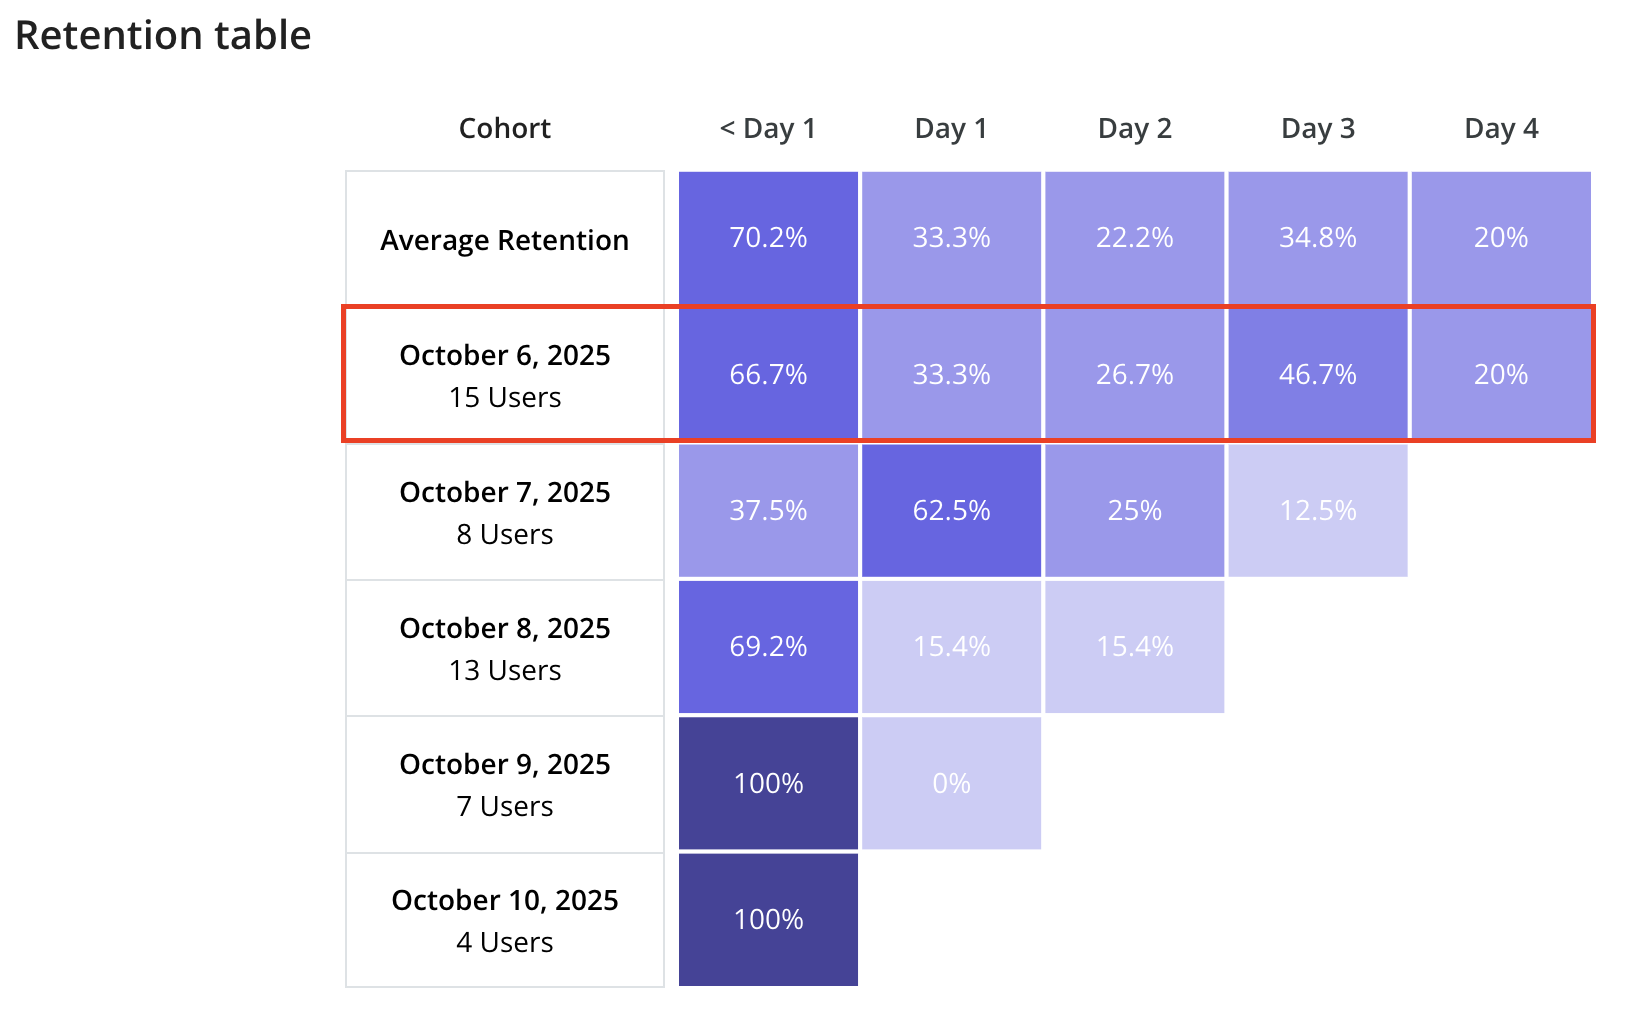
Retention Table – A detailed table displaying the exact number of users retained or dropped off for each day, week, or month within the selected time period.
.png?fit=max&auto=format&n=j6BdSiRiF3SCgUJf&q=85&s=2954a9069fb4f9dce5b36aa940d0d54a)
Example:
For example, if you run a query with the starting event as “Created Report” and the returning event as “Viewed Report”:- The highlighted row shows that on October 6th, 15 users created a report.
- Of those 15 users, 66.7% returned to view a report on the same day.
- On the next day (October 7th), 33.3% of the original 15 users returned to view a report, and the pattern continues for subsequent days.