Path reports are only available for Growth and Enterprise plans.
Use Cases
- Understand entry points – See where users first land in your application.
- Track next steps – Discover what actions users take immediately after signing up.
- Analyze navigation patterns – Learn how users move through your app and which features they use.
- Identify drop-offs – Pinpoint where users leave the journey or abandon key steps.
- Uncover activation drivers – Determine which actions lead to activation or trigger key events
Getting started with Paths
To get started with creating a Path, navigate to the Paths page from the navigation bar or through the ‘Create Report’ button within the Saved Reports page.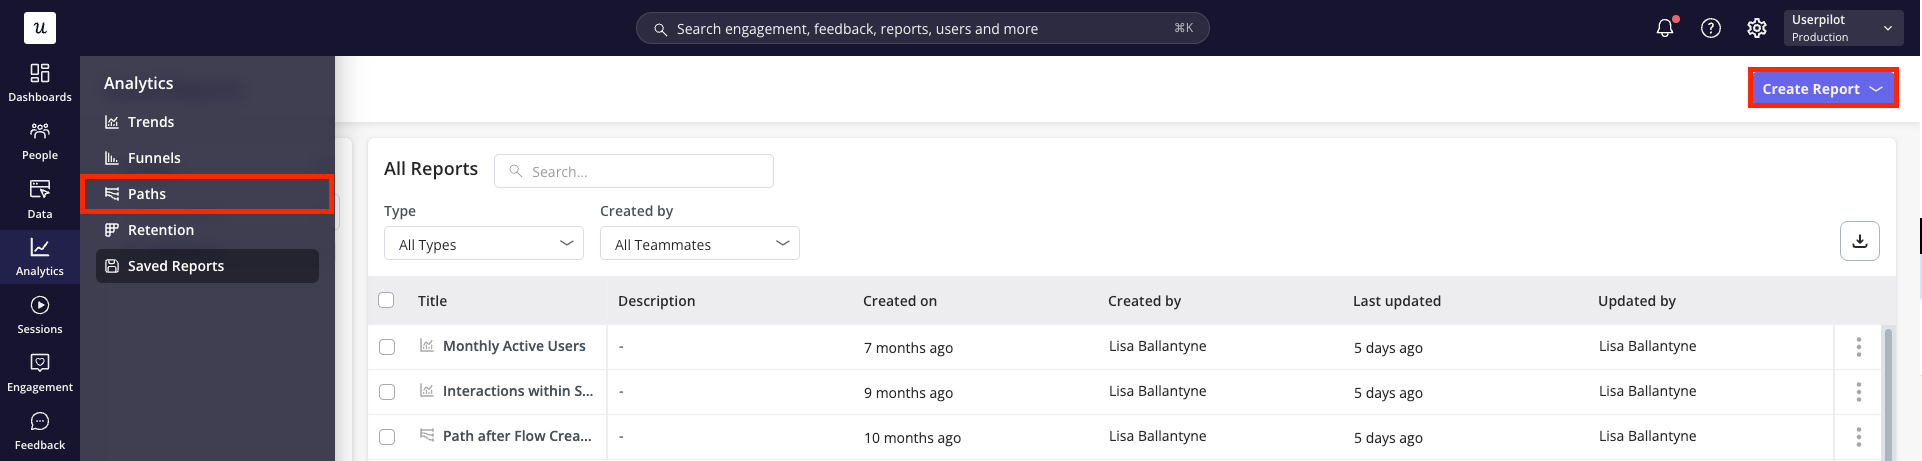
Building your Path Report
-
Firstly, choose whether you’d like to analyse the data on a user or company level.
.png?fit=max&auto=format&n=j6BdSiRiF3SCgUJf&q=85&s=18500f44ae679804c6cf096e6ffd40be "Image(23) Pn")
-
Next, define the metric for your path report. This is the key action or moment you want to analyze to understand user journeys before and after it occurs. You can choose from two categories:
- Events: Includes labeled events, tracked events, custom events, or feature tags.
- Pages: Includes views of your tagged pages.
.png?fit=max&auto=format&n=j6BdSiRiF3SCgUJf&q=85&s=ad95091a1c09973db9bc0cc6dc187a65 "Image(24) Pn")
- Once you’ve specified your key metric, specify how you’d like this metric to be measured (Coming soon):
- Unique users: count a single entry per user. This will represent the first time a user interacts with the key event within the specified time period
- Total count: count multiple entries per user. Users can re-enter the path multiple times throughout the selected time period and each time will be accounted for within the data.
- Specify how many steps before and after the key action you want to include in the path report.
.png?fit=max&auto=format&n=j6BdSiRiF3SCgUJf&q=85&s=b2cfb3d88f30ee18b40e993d1ced0e65 "Image(25) Pn")
- Filter your data to focus only on the most relevant information. Metrics can be filtered by:
- Event Properties (for inline filters only)
- User Properties (for user-level data only)
- Company Properties
-
Segments
.png?fit=max&auto=format&n=j6BdSiRiF3SCgUJf&q=85&s=17b2a9269fabd575ca8eae9b9f718ee7 "Image(26) Pn")
Analyzing your Results
Click ‘Run Query’ and choose the right data presentation options for your needs.-
Within the header, specify the:
a. Chart period: choose a time period from the default options (e.g. past 7 days, past 30 days, etc.) or specify a custom date range
b. Platform: focus on data from all platforms or choose to filter to only web or mobile data
.png?fit=max&auto=format&n=j6BdSiRiF3SCgUJf&q=85&s=a4bdc1e1e8511fb693957b8ac505a9d5)
-
Choose the chart type from the following options:
- All Paths: Displays every path captured based on your query settings.
- Top Path: Highlights only the path taken by the largest number of users.
To focus your path report solely on events, toggle off the “Include Pages” option to exclude page views.
-
At each step, Userpilot displays the four most common actions users take. All other actions are grouped under “Other Metrics,” while “Drop-offs” represent users or companies who did not perform any further actions and therefore exited the path.
.png?fit=max&auto=format&n=j6BdSiRiF3SCgUJf&q=85&s=b1852d613dc4582d9b5f457eabcd0682)
Advanced Features
1. Other Metrics (Coming soon)
To see which actions are included in “Other Events” and which users or companies performed them, click on the node. This opens a slideout where you can explore individual metrics and the percentage of the data they represent..png?fit=max&auto=format&n=j6BdSiRiF3SCgUJf&q=85&s=7a3b59e966285afe541be2dceec63f59)
2. Hide Metrics (Coming soon)
To simplify path reports and remove irrelevant data, you can hide specific metrics. This is helpful for eliminating noise from your chart, such as events that all users inevitably perform (e.g., after the “Create Report” event, users are always directed to the “Saved Reports” page, which isn’t a meaningful data point)..png?fit=max&auto=format&n=j6BdSiRiF3SCgUJf&q=85&s=0a371e7ca8fa1270362d897e2e3c4b6b)
FAQs
What’s the difference between Paths and Funnels in Userpilot?
What’s the difference between Paths and Funnels in Userpilot?
While Funnels show how users move through predefined steps, Paths provide a more flexible, visual representation of the actual routes users take. Paths help you discover user behavior patterns you might not be aware of, while Funnels are used to track specific goal completions.