Overview
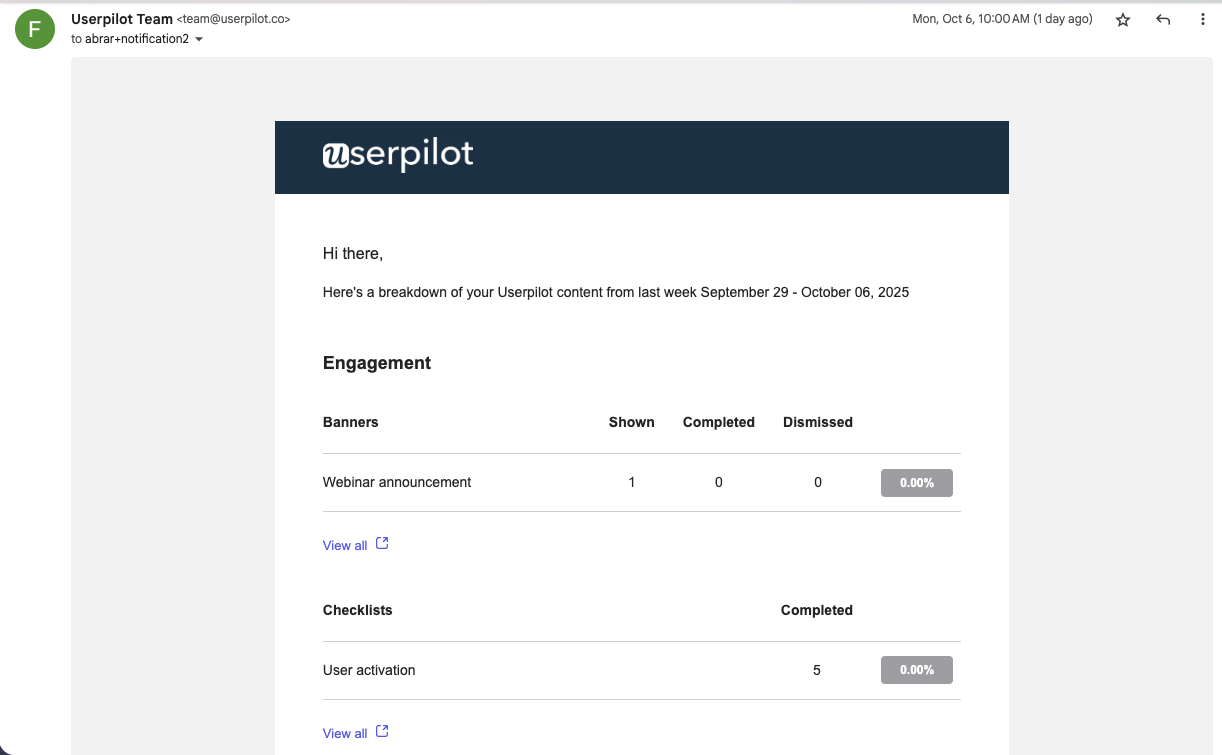
The Digest in Userpilot helps you stay on top of your key product insights automatically.It sends a customized summary email or Slack notification containing updates on the most important user activities and engagement metrics.
Instead of checking multiple reports, you can get everything that matters in one simple, scheduled summary. With the Digest, every team member can customize their own summary, decide what to include, and choose how and when to receive it.
Use cases
- Get weekly insights into how users engage with flows, pages, or checklists.
- Receive a summary of survey or NPS responses to track satisfaction trends.
- Review engagement data on spotlights, banners, and campaigns.
- Get a quick overview of user activity and performance without logging in.
What Userpilot offers in the Digest
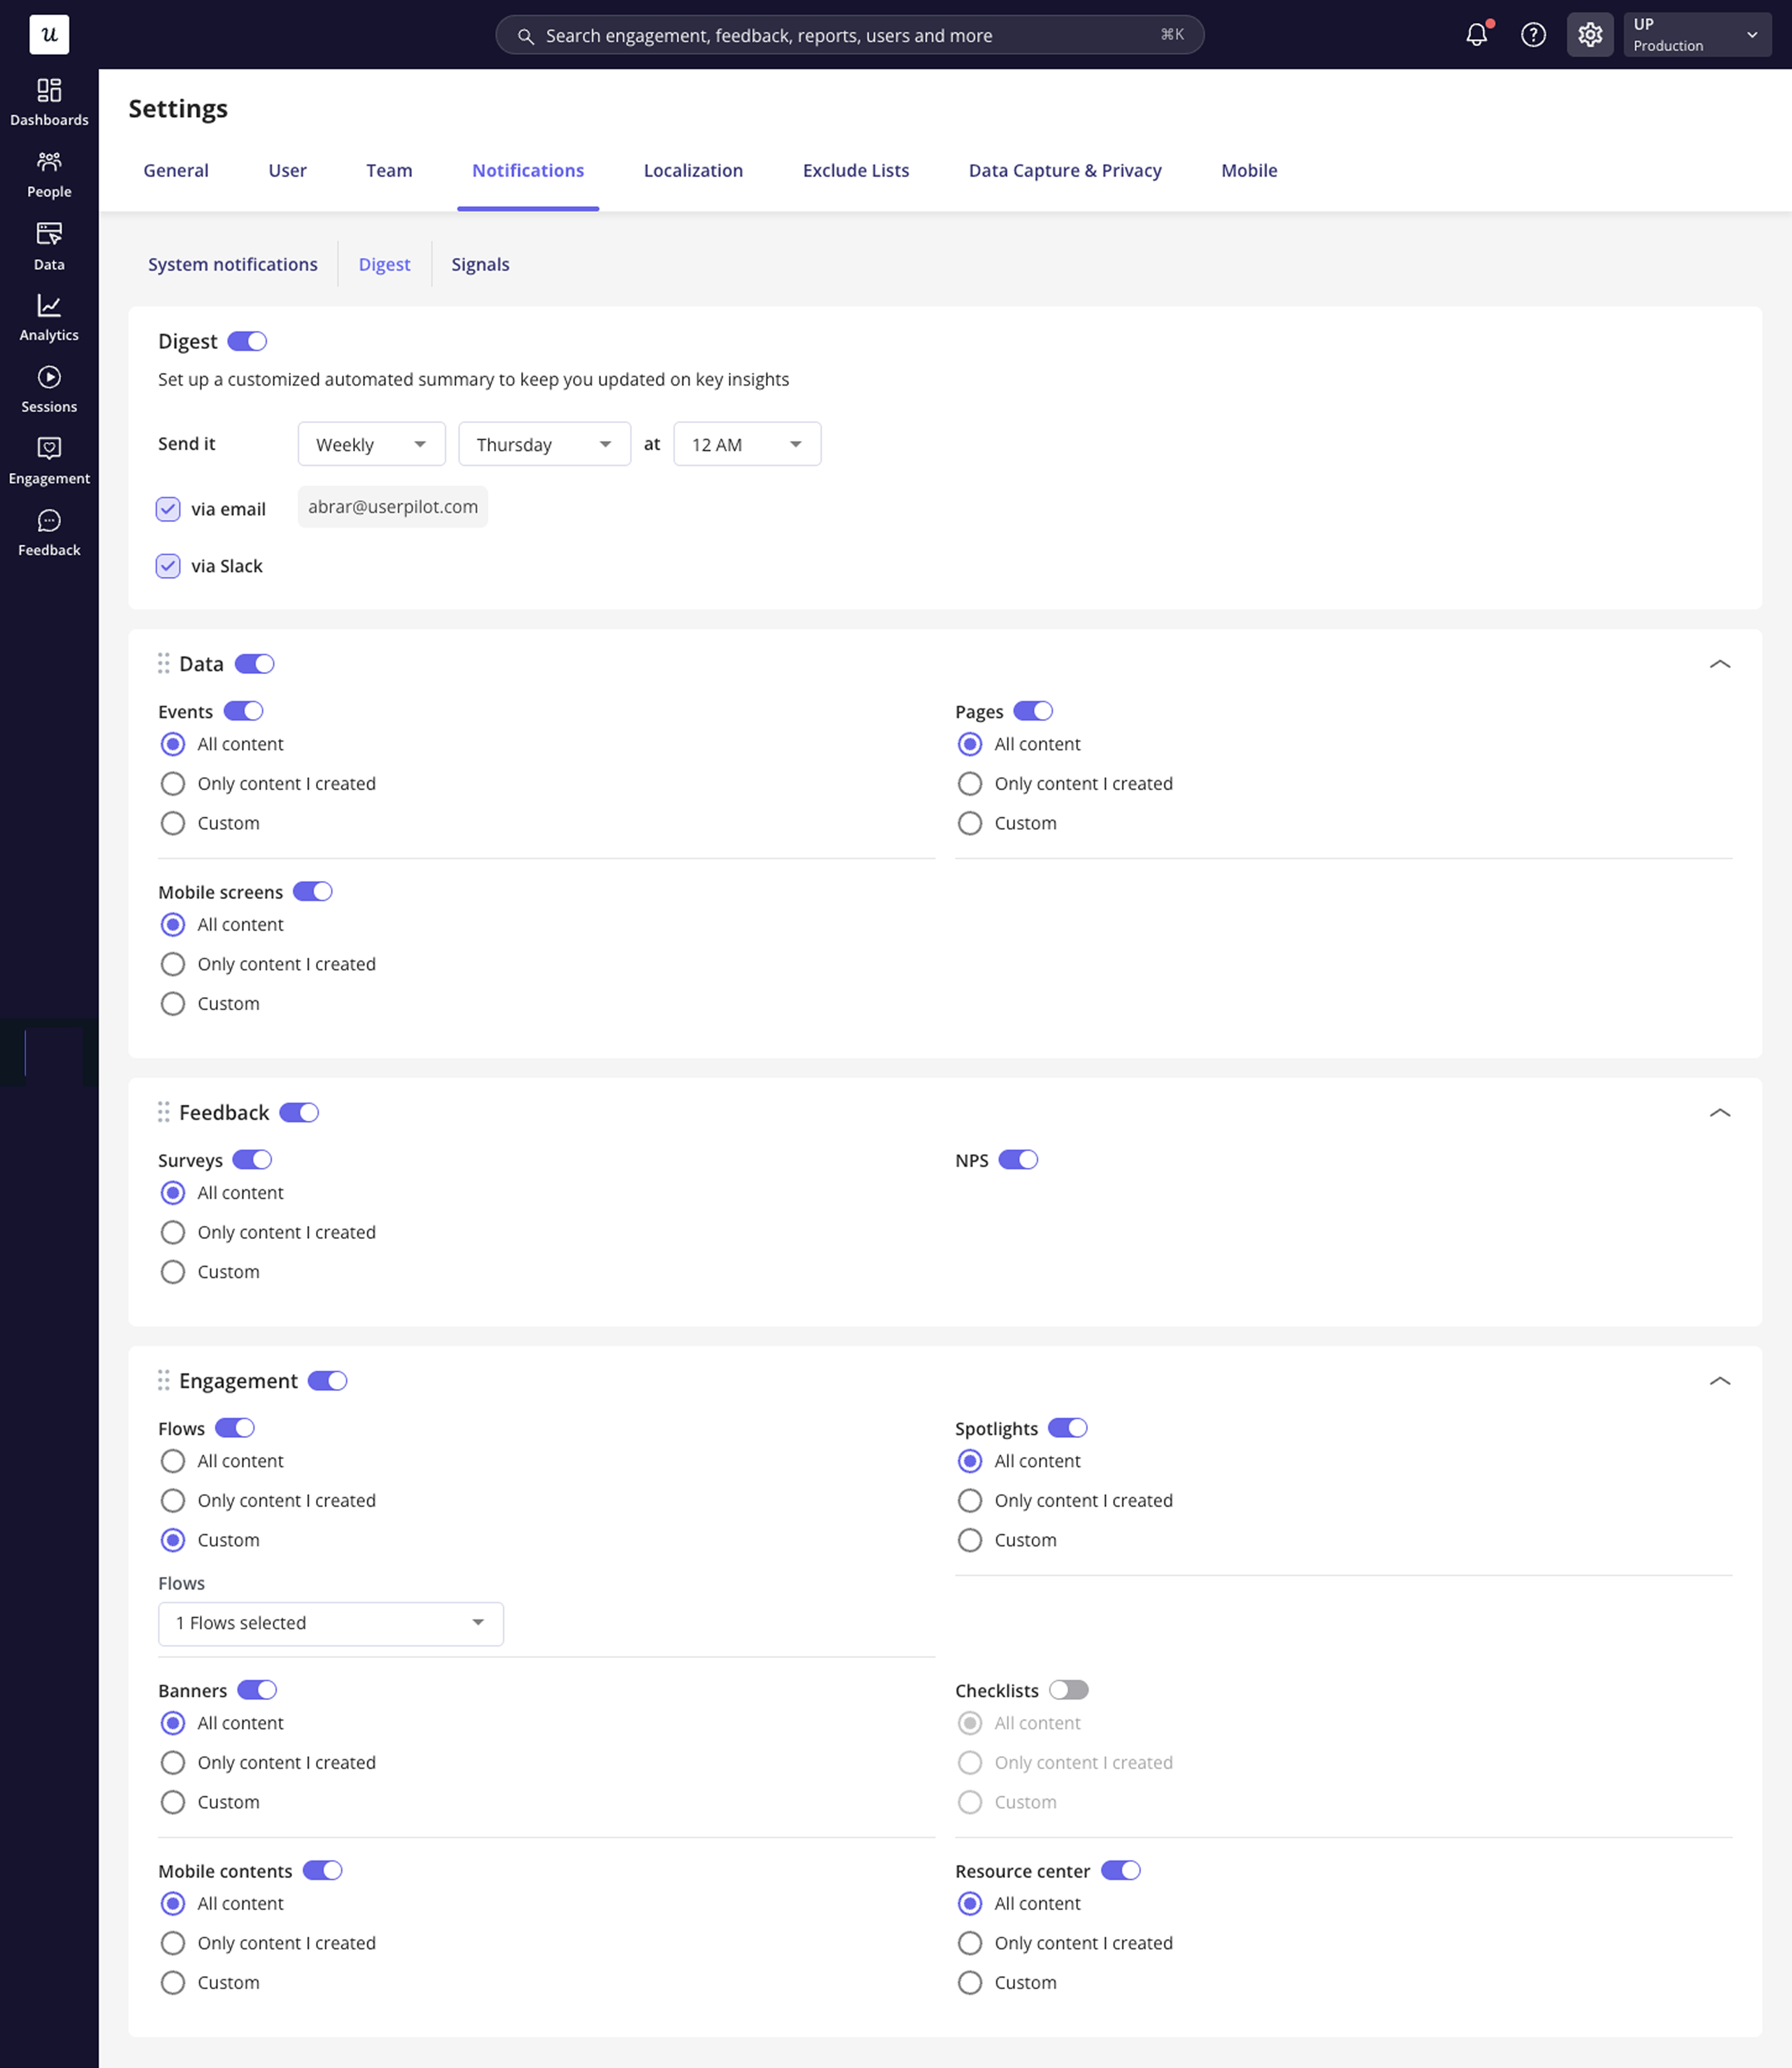
Userpilot’s Digest gives you full control over your notification preferences and structure:- Custom delivery - Choose how often you want to receive the summary: daily, weekly, or monthly, and send it via email or Slack.
- Category control - Enable or disable categories like Data, Feedback, and Engagement using toggles.
- Granular filters - Select whether to include all content, only content you created, or set custom filters.
- Personalized structure - Rearrange the order of sections in your Digest using drag-and-drop, so your most relevant insights always appear first.
- User-Level configuration - The Digest is fully personal. Each team member can set up their own Digest preferences, and notifications are sent only to the logged-in user.
How percentages and trends are calculated in the digest email
The Digest email calculates metrics by comparing performance in the current period with the previous equivalent period.Weekly digest
If the digest is scheduled to be sent on a Wednesday, the current period covers the time from that Wednesday to the following Wednesday. The previous period covers the Wednesday of the prior week up to the current Wednesday. The system then compares the data between these two time frames to show trends.
\
Monthly digestIf the digest is scheduled to be sent on the 21st of April, the current period runs from the 21st of March to the 21st of April. The previous period runs from the 21st of February to the 21st of March. The system compares these periods to highlight changes in performance.
- In the Survey report, the Completed column indicates the number of users who have answered all survey questions.
- For NPS, the percentage represents the number of users who selected a specific score divided by the total number of users who submitted an NPS response.
Please note that all percentage values reflect trends in the data.
The trend reflects the number of survey completed event.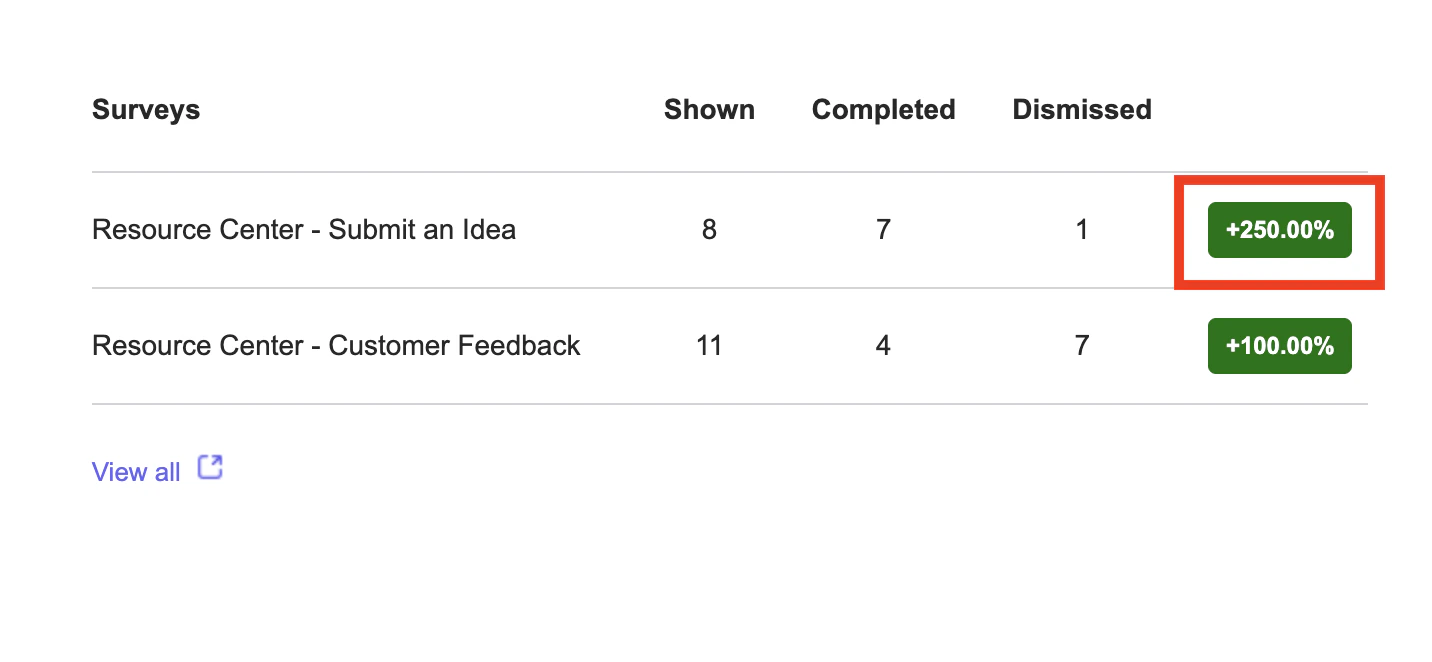
.png?fit=max&auto=format&n=O2AF4wnp9wmco4oH&q=85&s=3d568e746f4edf2a50c0b3f3ad1a3921)
Notification examples
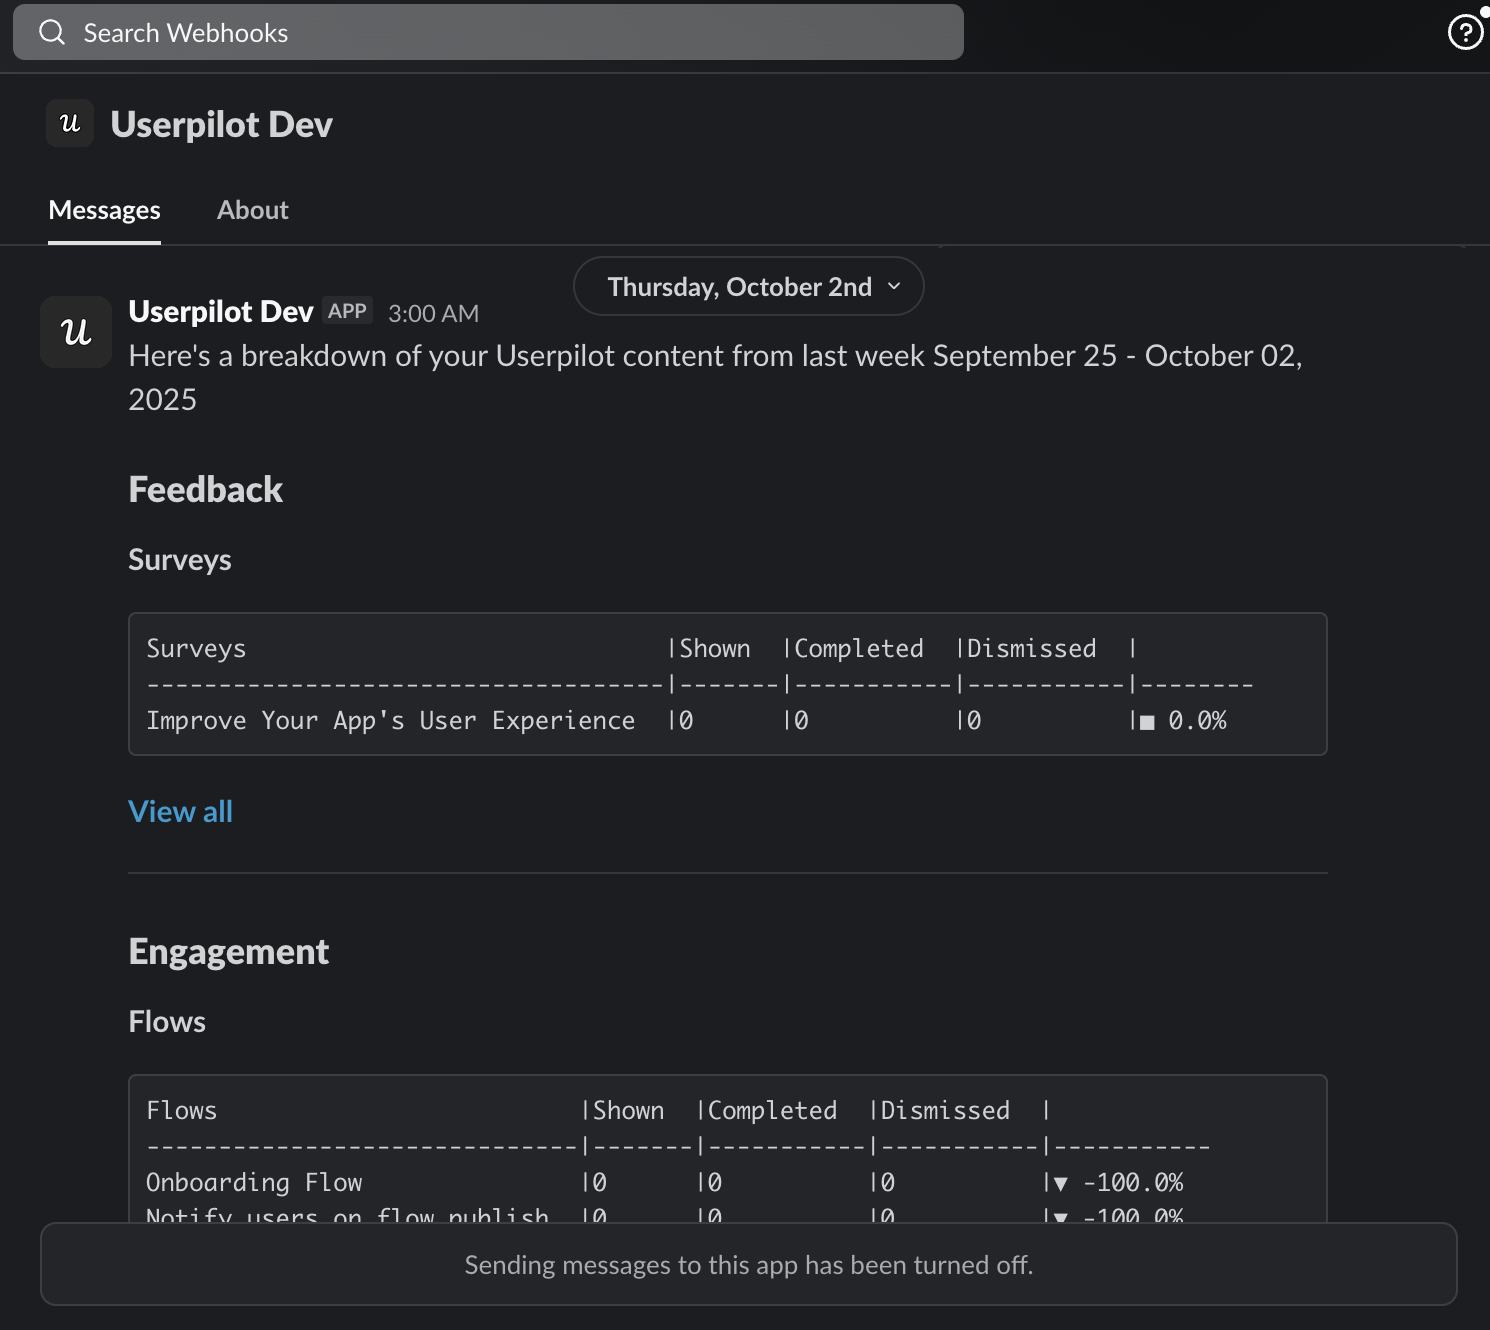
- Slack notification
- Email notification