> ## Documentation Index
> Fetch the complete documentation index at: https://docs.userpilot.com/llms.txt
> Use this file to discover all available pages before exploring further.
# Overview
> See how people are using your AI agents, where conversations succeed or break down, and how agent usage connects to the rest of your product data.
For information on connecting your agent data to Userpilot, go to [Agent SDK Installation](/agent-sdk-installation).
## Overview
Agent Analytics extends Userpilot's analytics to your AI agents. Instead of digging through raw chat logs or a separate LLM dashboard, it gives you one place to answer questions like: How many people are talking to the agent? What are they trying to do? Where is it failing them? And is using the agent connected to people sticking around?
## Use Cases
* **Prove agent ROI** — connect agent usage to activation, adoption, and retention instead of treating the agent as a black box.
* **Spot where the agent is failing users** — surface fallback responses, failed actions, escalations, and frustrated users without reading every transcript.
* **Understand what people actually use the agent for** — see the topics and entry points driving conversations, and feed that into your roadmap.
* **Investigate a specific issue** — jump from a topic, a failure signal, or a user's profile straight into the full conversation transcript.
* **Report and segment on agent usage** — bring agent conversation data into Report Builder, Segments, Sessions, and Engagement alongside the rest of your product data.
## Getting Started
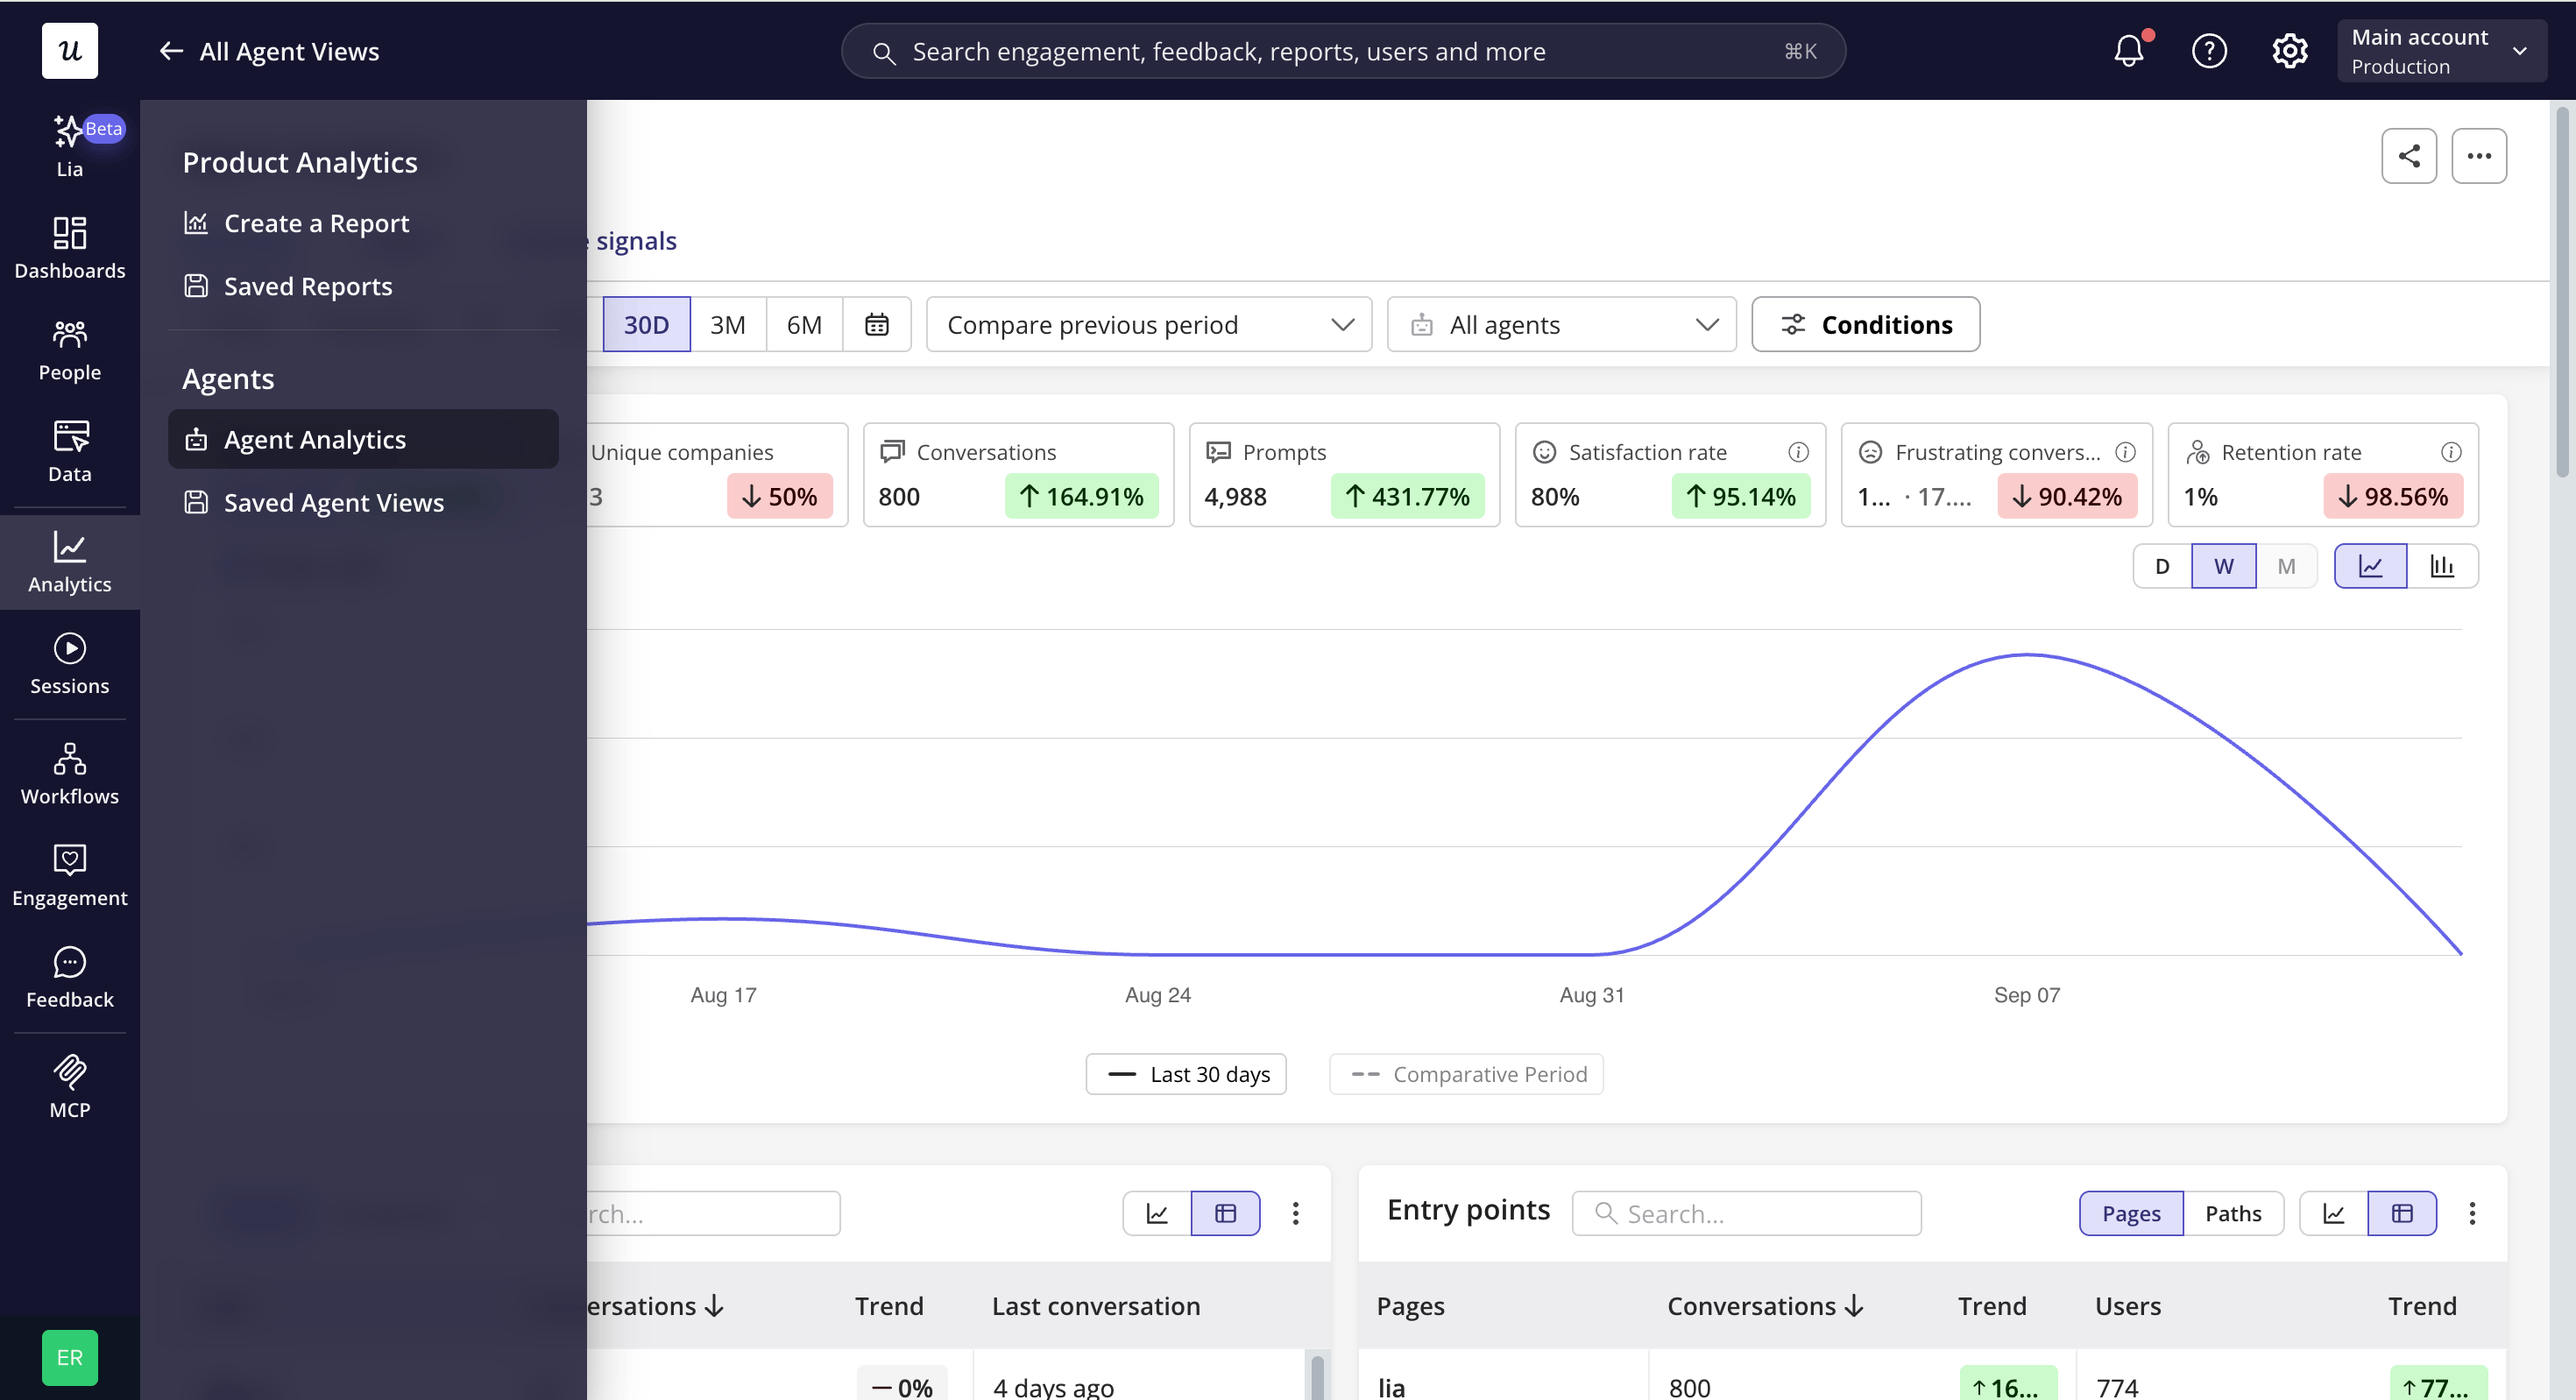
To get started, simply navigate to the Agent Anlytics tab under **Agents** in the main **Analytics** navigation, alongside **Saved Agent Views**.
 ## Filters and controls
To narrow down the data that surfaces within the dashboard, specify conditions that you're particularly interested in.
* **Time range** – select a preset range or a custom date range.
* **Comparative period** – compare the selected range to the previous period, or to a custom period of your choosing.
* **Agent** – filter to one agent or several. Defaults to **All agents**.
* **Conditions** – use the same user and company filters you rely on elsewhere in Userpilot, or conversation filters based on the metadata captured on the `Conversation started` event — topic, trigger, feedback, and more.
## Key stats
## Filters and controls
To narrow down the data that surfaces within the dashboard, specify conditions that you're particularly interested in.
* **Time range** – select a preset range or a custom date range.
* **Comparative period** – compare the selected range to the previous period, or to a custom period of your choosing.
* **Agent** – filter to one agent or several. Defaults to **All agents**.
* **Conditions** – use the same user and company filters you rely on elsewhere in Userpilot, or conversation filters based on the metadata captured on the `Conversation started` event — topic, trigger, feedback, and more.
## Key stats
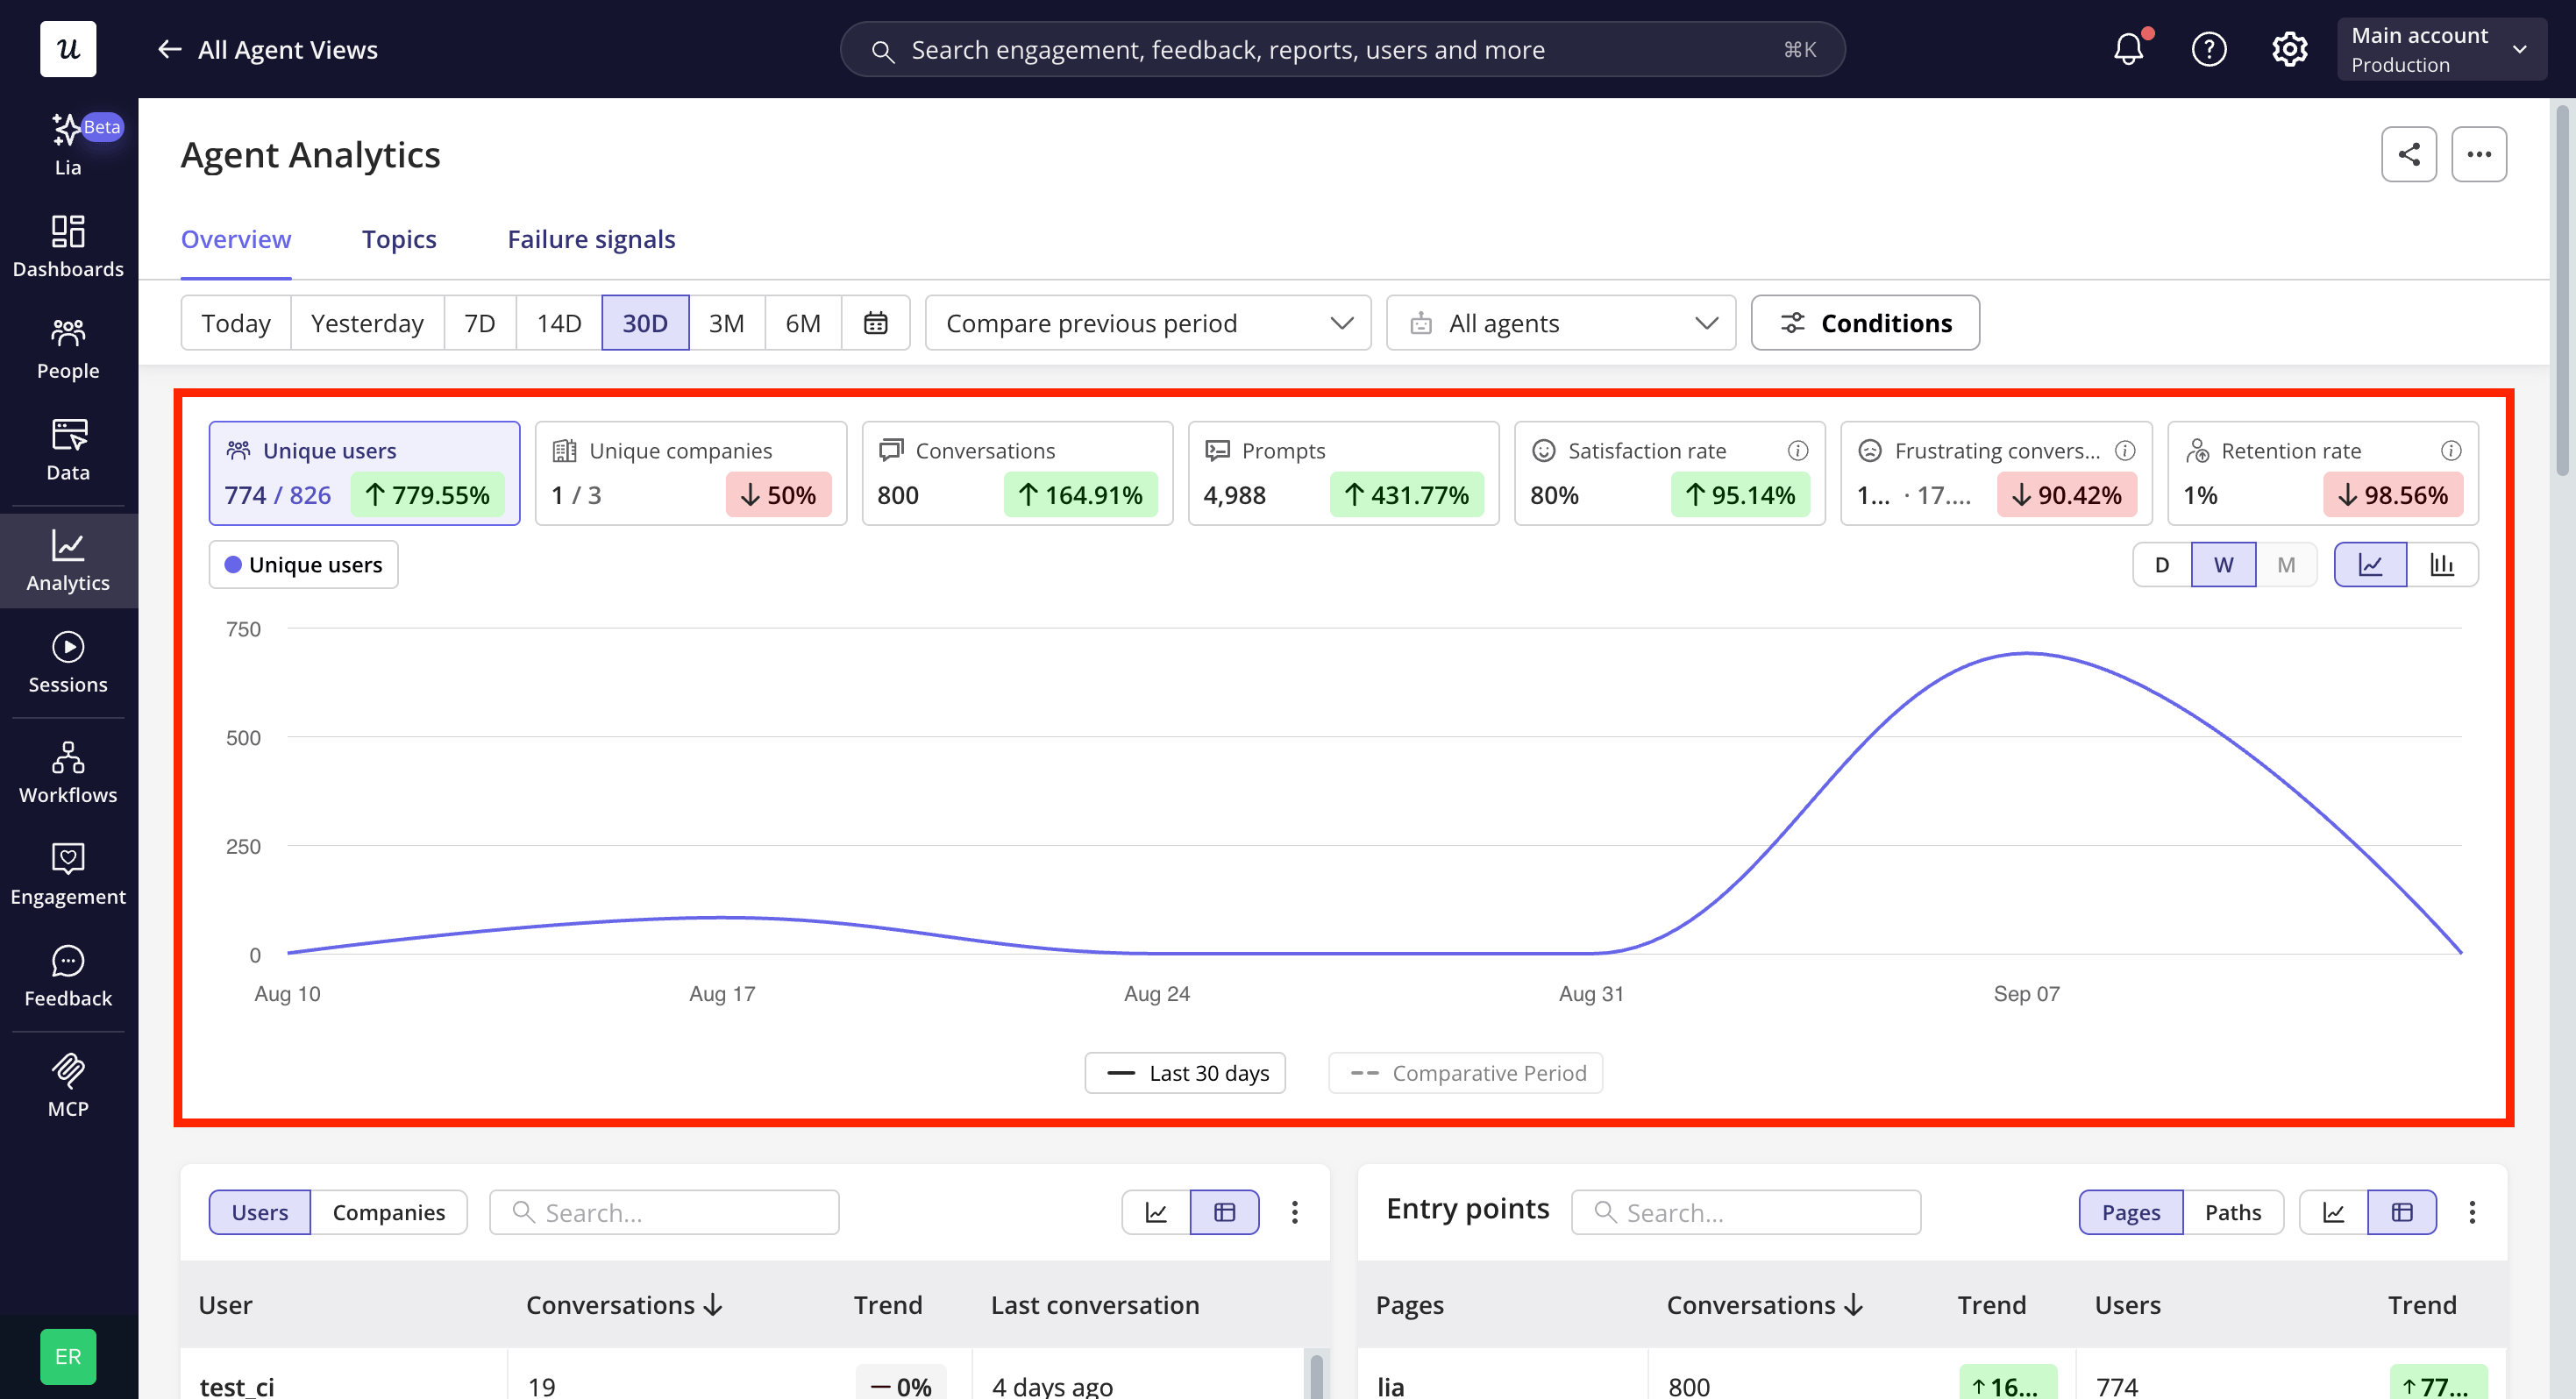 Seven key stats give you an at-a-glance read on how your agent is performing — who's using it, how satisfied they are, and whether it's bringing them back. Click into any stat to see exactly which conversations or users are behind the number.
| Stat | What it measures |
| :- | :- |
| **Unique users** | The number of people who had at least one conversation with the agent in the selected period. |
| **Unique companies** | The number of companies with at least one conversation with the agent in the selected period. |
| **Conversations** | The total number of conversations held with the agent. |
| **Prompts** | The total number of prompts users entered into the agent. |
| **Satisfaction rate** | The percentage of submitted ratings that are positive (thumbs up ÷ total ratings). |
| **Frustrating conversations** | The number (and share) of conversations where at least one AI-detected frustration signal was found. |
| **Retention rate** | The percentage of users who came back and used the agent again at least once within the selected range. |
## Reports
Seven key stats give you an at-a-glance read on how your agent is performing — who's using it, how satisfied they are, and whether it's bringing them back. Click into any stat to see exactly which conversations or users are behind the number.
| Stat | What it measures |
| :- | :- |
| **Unique users** | The number of people who had at least one conversation with the agent in the selected period. |
| **Unique companies** | The number of companies with at least one conversation with the agent in the selected period. |
| **Conversations** | The total number of conversations held with the agent. |
| **Prompts** | The total number of prompts users entered into the agent. |
| **Satisfaction rate** | The percentage of submitted ratings that are positive (thumbs up ÷ total ratings). |
| **Frustrating conversations** | The number (and share) of conversations where at least one AI-detected frustration signal was found. |
| **Retention rate** | The percentage of users who came back and used the agent again at least once within the selected range. |
## Reports
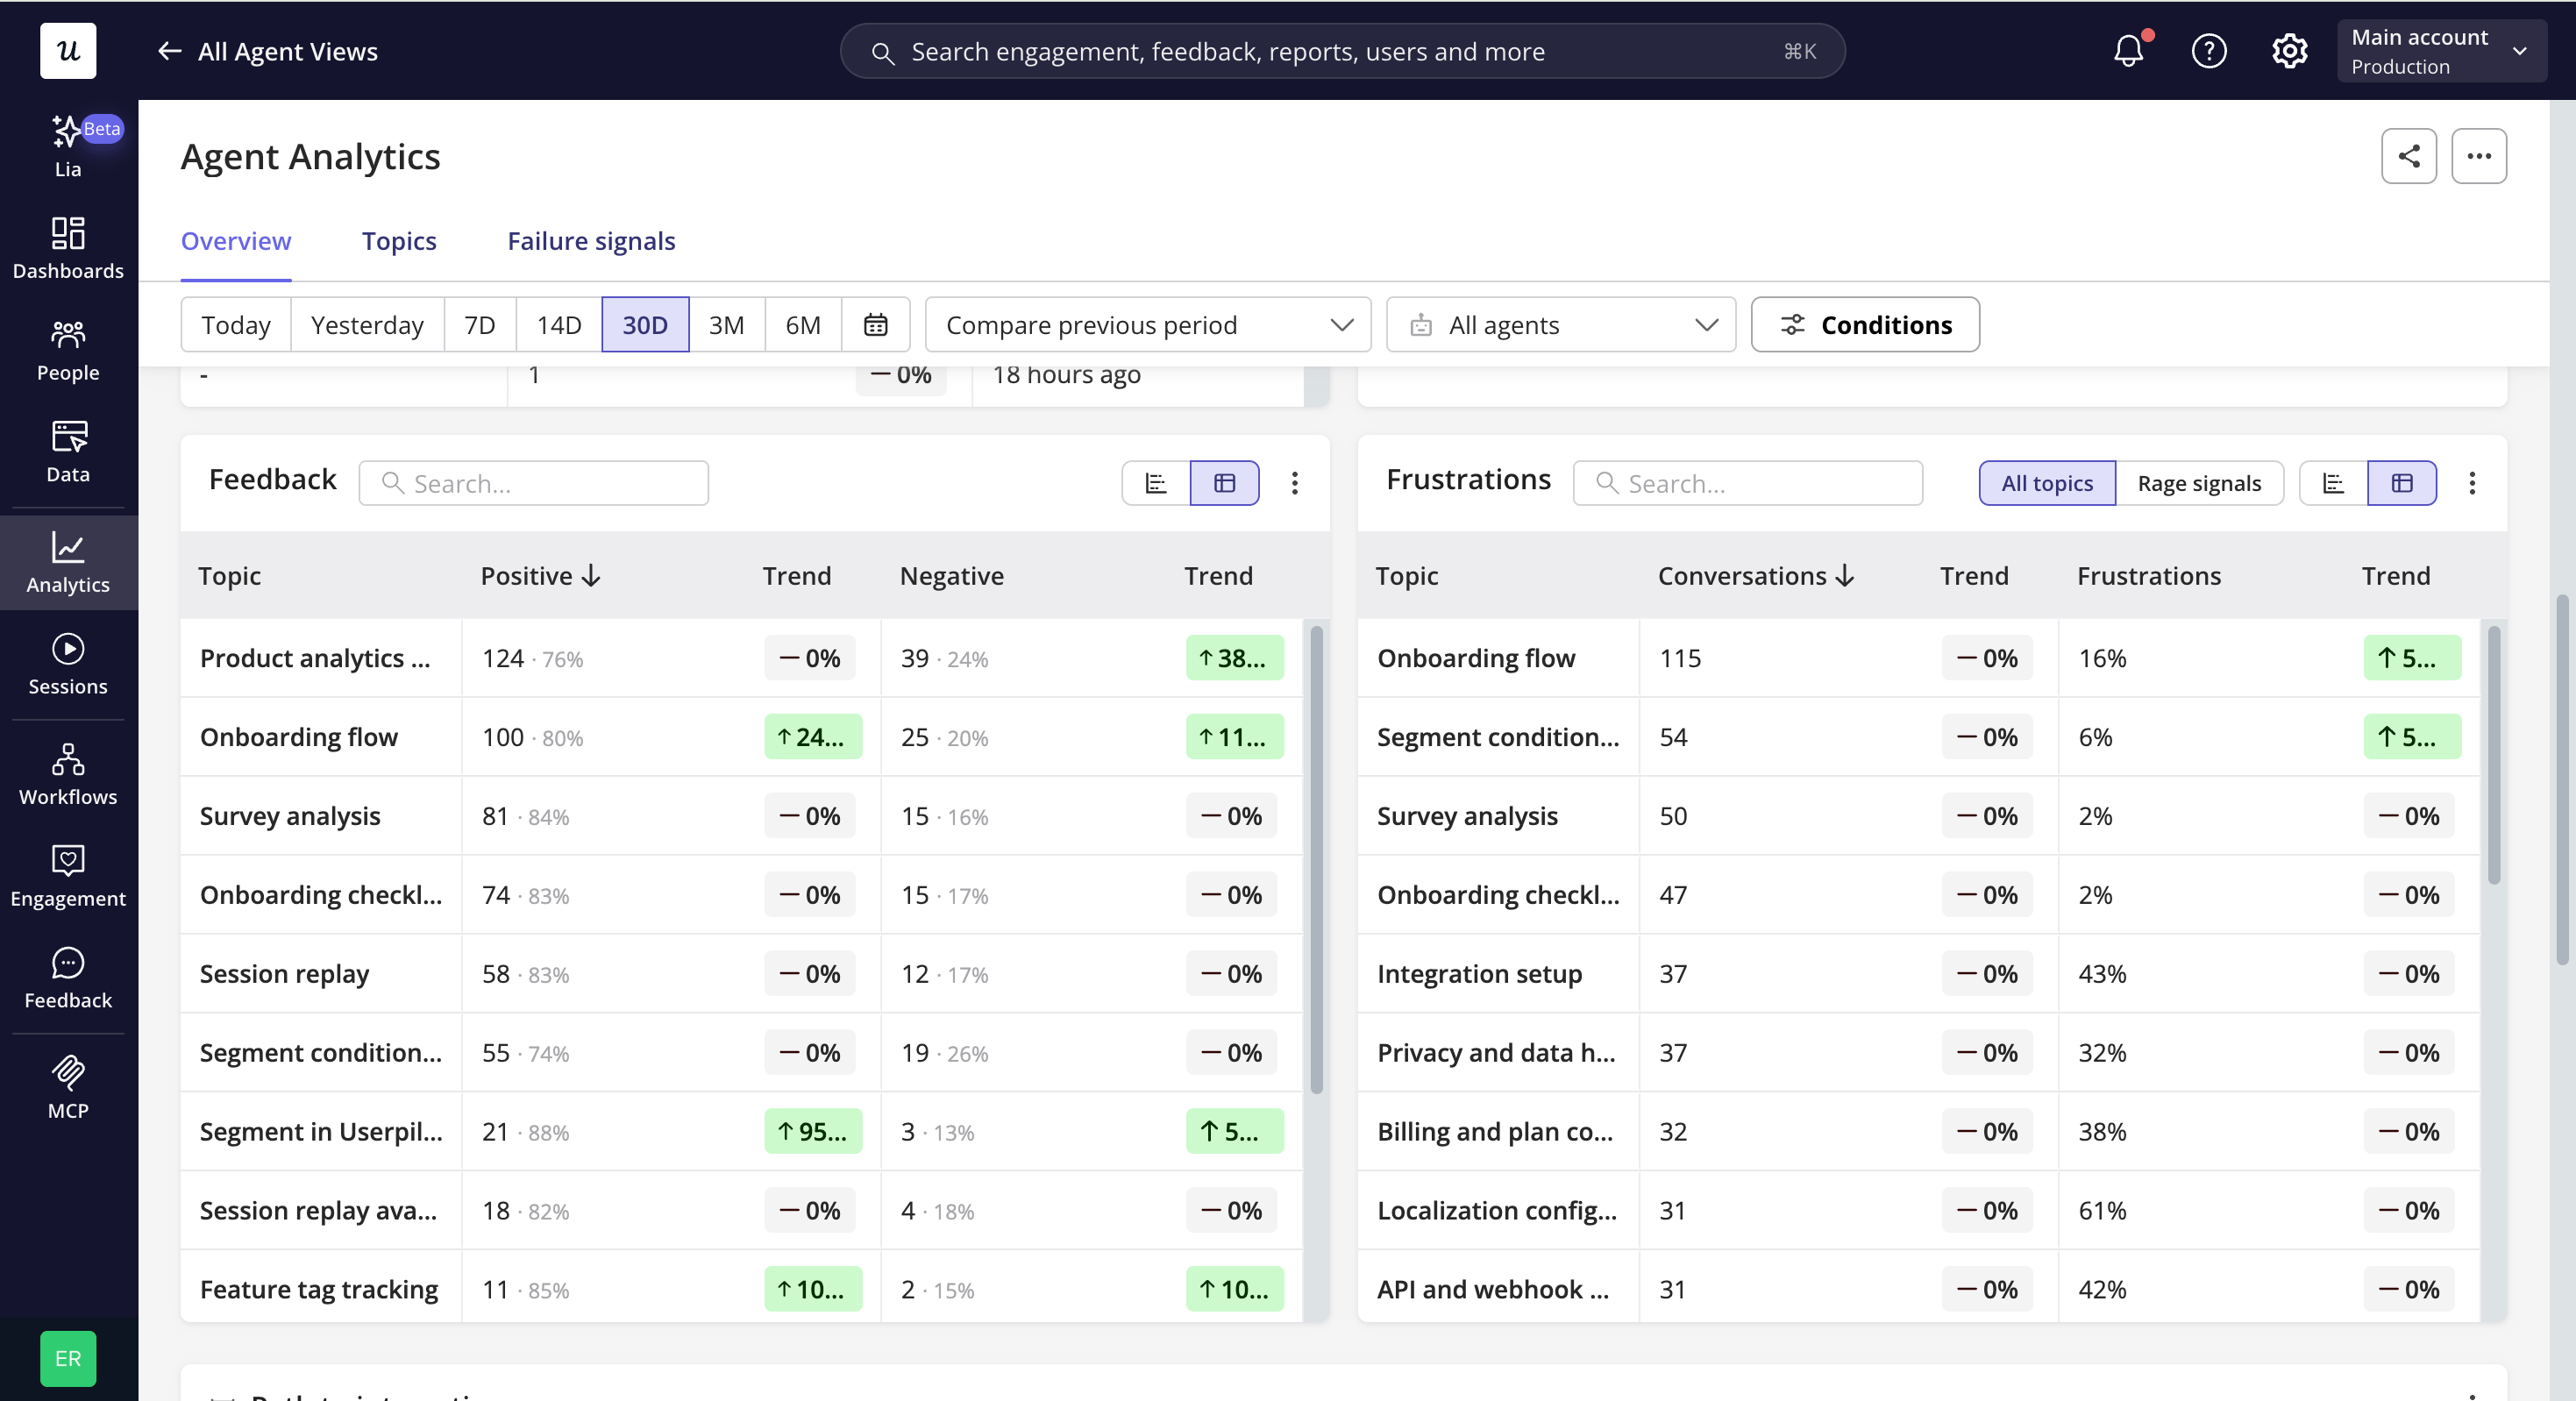 Beyond the key stats, a set of reports helps you dig into agent usage in more depth:
* **Users / Companies**
Identify exactly who's getting the most value from the agent, whether you care about individual power users or which accounts are relying on it most.
* **Entry points**
Understand what's actually driving people to the agent — which pages or URLs are prompting the conversation — so you know where it's earning its place in the experience.
* **Feedback**
See how satisfied people are, broken down by topic, so you can tell which use cases the agent is nailing and which need work. This builds as your agent collects feedback.
* **Frustrations**
Understand what's frustrating your users and why, broken down by topic and by the specific behaviour pattern driving it. Patterns the AI detects include:
| Signal | What it looks like |
| - | - |
| Profanity or offensive language | Swearing or abusive language directed at the agent. |
| Strong negative sentiment | Explicit frustration or anger, e.g. "I hate this," "this is broken." |
| Blaming the agent or product | Direct accusations, e.g. "you messed this up." |
| ALL-CAPS emphasis | Sentences typed in all caps. |
| Excessive punctuation | Repeated punctuation, e.g. "why??!!" |
| Exaggerated letter repetition | Stretched-out words, e.g. "whyyyy." |
| Repeated question rephrasing | The same question asked again in different words. |
| Direct correction or rejection | Explicitly telling the agent it's wrong. |
| Confrontational questioning | Aggressive "why" or "how" challenges. |
* **Path of interaction**
See what leads people to the agent and what they do right after, so you can tell whether it's solving problems in the flow of work or pulling people out of one.
* **Conversation length**
Gauge how much effort conversations take, by prompt count and duration — a useful signal for spotting overly long or complicated interactions.
* **Agent impact on retention**
Understand whether talking to the agent is connected to people coming back, by comparing retention for users who did and didn't interact with it.
## Saving and sharing a view
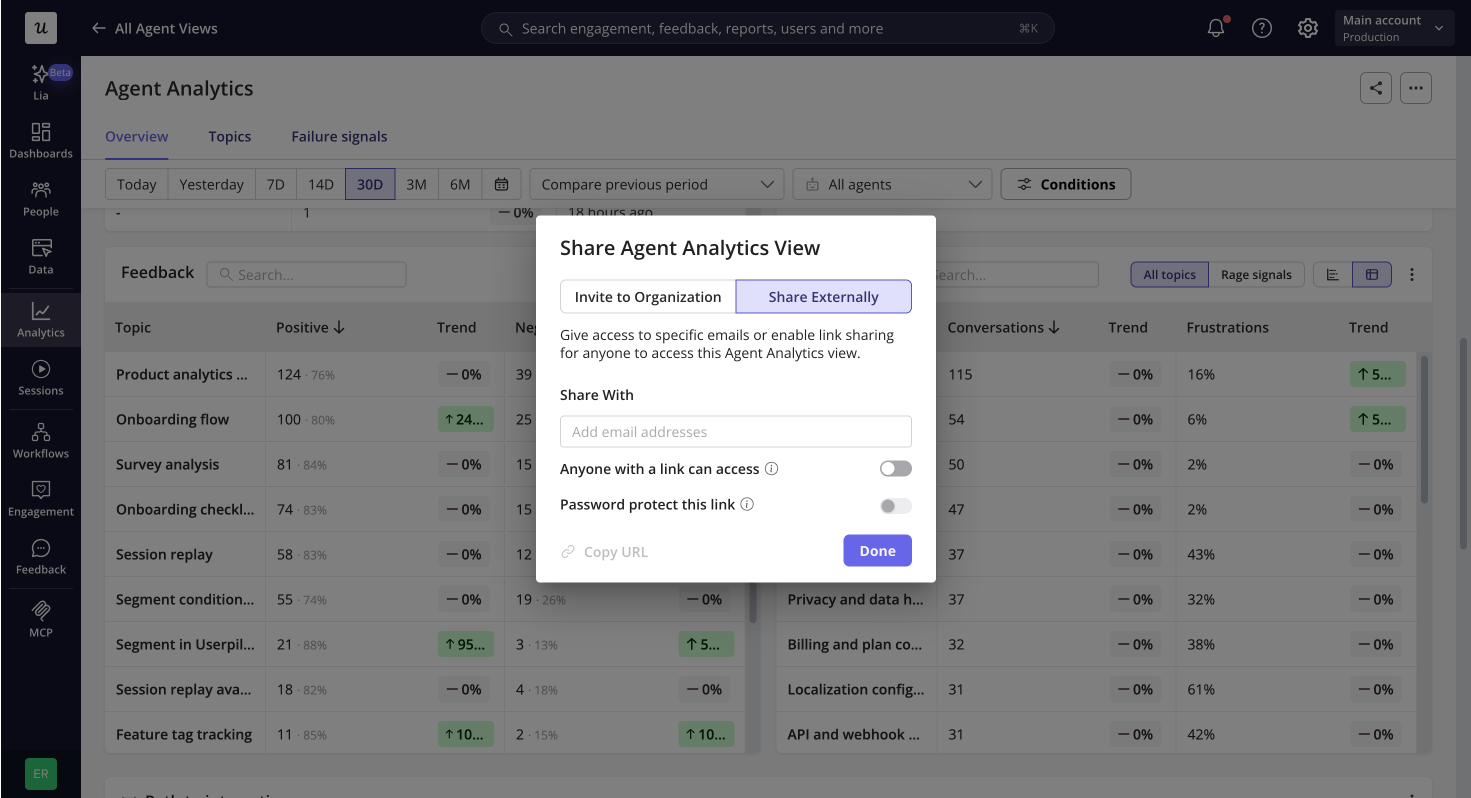
Save a view when you want to come back to a specific cut of the data — a particular agent, time range, or set of conditions — without rebuilding it each time. Saved views can be organized into folders and favorited for quick access.
Share a view when you want teammates, or people outside your account, to see the same analysis.
Beyond the key stats, a set of reports helps you dig into agent usage in more depth:
* **Users / Companies**
Identify exactly who's getting the most value from the agent, whether you care about individual power users or which accounts are relying on it most.
* **Entry points**
Understand what's actually driving people to the agent — which pages or URLs are prompting the conversation — so you know where it's earning its place in the experience.
* **Feedback**
See how satisfied people are, broken down by topic, so you can tell which use cases the agent is nailing and which need work. This builds as your agent collects feedback.
* **Frustrations**
Understand what's frustrating your users and why, broken down by topic and by the specific behaviour pattern driving it. Patterns the AI detects include:
| Signal | What it looks like |
| - | - |
| Profanity or offensive language | Swearing or abusive language directed at the agent. |
| Strong negative sentiment | Explicit frustration or anger, e.g. "I hate this," "this is broken." |
| Blaming the agent or product | Direct accusations, e.g. "you messed this up." |
| ALL-CAPS emphasis | Sentences typed in all caps. |
| Excessive punctuation | Repeated punctuation, e.g. "why??!!" |
| Exaggerated letter repetition | Stretched-out words, e.g. "whyyyy." |
| Repeated question rephrasing | The same question asked again in different words. |
| Direct correction or rejection | Explicitly telling the agent it's wrong. |
| Confrontational questioning | Aggressive "why" or "how" challenges. |
* **Path of interaction**
See what leads people to the agent and what they do right after, so you can tell whether it's solving problems in the flow of work or pulling people out of one.
* **Conversation length**
Gauge how much effort conversations take, by prompt count and duration — a useful signal for spotting overly long or complicated interactions.
* **Agent impact on retention**
Understand whether talking to the agent is connected to people coming back, by comparing retention for users who did and didn't interact with it.
## Saving and sharing a view
Save a view when you want to come back to a specific cut of the data — a particular agent, time range, or set of conditions — without rebuilding it each time. Saved views can be organized into folders and favorited for quick access.
Share a view when you want teammates, or people outside your account, to see the same analysis.
 ## Who can access Agent Analytics
Everyone with access to Userpilot can see the general Agent Analytics screens — Overview, Topics, and Failure Signals — regardless of role. Access to individual conversations (viewing, sharing, deleting) and to managing connected agents is controlled separately, under **Settings > Roles > Analytics > Agent Analytics**.
## Using Agent Analytics data elsewhere in Userpilot
Every agent interaction is tracked as a `Conversation started` event, the same way any other event is in Userpilot — which means it's available outside of Agent Analytics too:
* **Segments and Conditions**, to build audiences based on agent usage.
* **Report Builder**, to build custom reports.
* **Sessions**, as a key event filter.
* **Engagement (flows, banners, etc.)**, in trigger settings and audience conditions.
The event carries rich metadata you can filter and report on, including:
| Property | Description |
| - | - |
| Agent / Agent ID | The agent involved, by name and by a stable ID that doesn't change if the agent is renamed. |
| Length | Number of prompts in the conversation. |
| Duration | Total time the user spent waiting for agent replies (idle pauses between exchanges are not counted). |
| Topic | The topic the conversation was classified into. |
| Feedback | Positive or negative, if given. |
| Frustration signal / Failure signal | The specific signal identified, if any. |
| Platform | Desktop or mobile. |
| Version / Model | The agent version and underlying LLM model in use at the time. |
This documentation is built and hosted on [Mintlify](https://mintlify.com), a developer documentation platform.
## Who can access Agent Analytics
Everyone with access to Userpilot can see the general Agent Analytics screens — Overview, Topics, and Failure Signals — regardless of role. Access to individual conversations (viewing, sharing, deleting) and to managing connected agents is controlled separately, under **Settings > Roles > Analytics > Agent Analytics**.
## Using Agent Analytics data elsewhere in Userpilot
Every agent interaction is tracked as a `Conversation started` event, the same way any other event is in Userpilot — which means it's available outside of Agent Analytics too:
* **Segments and Conditions**, to build audiences based on agent usage.
* **Report Builder**, to build custom reports.
* **Sessions**, as a key event filter.
* **Engagement (flows, banners, etc.)**, in trigger settings and audience conditions.
The event carries rich metadata you can filter and report on, including:
| Property | Description |
| - | - |
| Agent / Agent ID | The agent involved, by name and by a stable ID that doesn't change if the agent is renamed. |
| Length | Number of prompts in the conversation. |
| Duration | Total time the user spent waiting for agent replies (idle pauses between exchanges are not counted). |
| Topic | The topic the conversation was classified into. |
| Feedback | Positive or negative, if given. |
| Frustration signal / Failure signal | The specific signal identified, if any. |
| Platform | Desktop or mobile. |
| Version / Model | The agent version and underlying LLM model in use at the time. |
This documentation is built and hosted on [Mintlify](https://mintlify.com), a developer documentation platform.